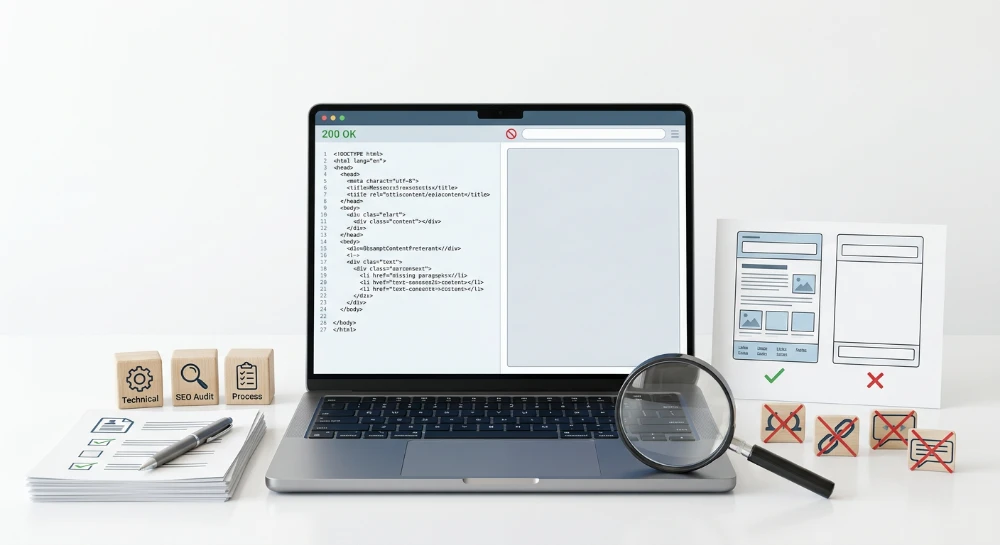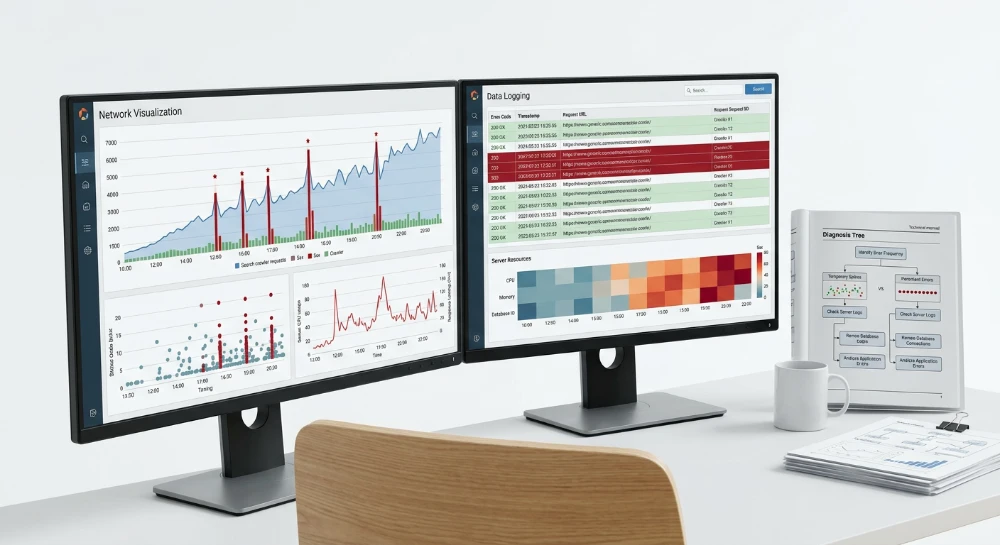
When search engine crawlers encounter 5xx server errors, it indicates a failure on the server side to process an otherwise valid request. Unlike 4xx errors that signal client-side issues like dead links, a 5xx status code means the server itself could not fulfill the request. When a search engine repeatedly receives these failure responses, it will typically reduce its crawl rate to avoid overloading the infrastructure, which can eventually stall the indexing of new or updated content.
Diagnosing these crawl failures requires distinguishing between routine, temporary outages and systemic infrastructure issues. A brief spike in server errors might naturally occur during a scheduled deployment, a brief maintenance window, or a transient traffic surge. However, persistent 5xx errors often point to backend resource exhaustion, database locks, or misconfigurations in reverse proxies that demand deeper investigation.
Restoring a reliable crawl state relies on correlating external crawler data with internal diagnostics. By matching search console error reports against server access logs and application performance monitors, administrators can identify the specific bottlenecks triggering the failures, deploy the necessary infrastructure or code adjustments, and validate that the underlying server issues are fully resolved.
Decoding common 5xx status codes
Modern web infrastructure rarely consists of a single server. A search engine crawler's request typically travels through a chain of intermediaries, such as content delivery networks, load balancers, and reverse proxies, before reaching the origin application server. The specific 5xx status code returned helps identify exactly where in this request chain the failure occurred.
500 Internal server error
A 500 status code is a generic response indicating that the server encountered an unexpected condition preventing it from fulfilling the request. This error originates at the final destination in the request chain, typically the origin web server or the application itself.
When a crawler receives a 500 error, it means the request successfully navigated all network layers and intermediaries, but the backend system failed to process it. Common triggers include fatal application code errors, exhausted memory limits within the application script, syntax errors in server configuration files, or internal database connection failures.
502 Bad gateway
A 502 status code indicates that a server acting as a gateway or proxy received an invalid response from an inbound server further up the chain. The failure occurs in the communication between an intermediary network node and the origin server.
In this scenario, the edge server or load balancer accepts the crawler's request and forwards it to the upstream application. If the application server drops the connection abruptly, returns malformed data, or the upstream process crashes while formatting the response, the proxy cannot parse the output. The proxy then returns a 502 error to the crawler. This often points to unstable upstream services, process managers terminating prematurely, or misaligned proxy buffer configurations.
503 Service unavailable
A 503 status code signals that the server is temporarily unable to handle the request. Unlike a 500 error where the application crashes unexpectedly, a 503 usually indicates that the server is functioning at a fundamental level but cannot accept new requests at that exact moment.
This response can originate from either the origin server or a load balancer. It typically occurs when the infrastructure is deliberately placed into maintenance mode, or when server resources are exhausted due to heavy load, causing the server to hit maximum worker or concurrency limits. A 503 communicates a capacity or administrative limitation rather than a fatal code execution error.
504 Gateway timeout
A 504 status code occurs when a server acting as a gateway or proxy does not receive a timely response from the upstream server it needs to access in order to complete the request. The failure lies in the latency of the connection between the proxy layer and the origin server.
When a crawler initiates a request, the reverse proxy sets a maximum wait time for the backend to deliver the assembled page. If the origin server becomes bogged down by highly complex database queries, inefficient application logic, or heavy backend processing, it may exceed this time limit. The proxy terminates the waiting connection and serves a 504 error to the crawler, indicating that the backend was too slow to respond, even if the application did not technically crash.
Run a deep technical crawl to identify 4xx errors, missing meta tags, and indexation blockers.
Locating crawl errors in Google search console
Google Search Console provides native reporting features to identify exactly when and where Googlebot encounters 5xx status codes. Analyzing these reports helps determine whether failures are isolated to specific URL paths or affect the entire host.
Finding URL-Specific errors in the page indexing report
The Page Indexing report categorizes pages that Google could not index during past crawl attempts. Selecting the "Server error (5xx)" reason displays a sample list of affected URLs alongside the date of the failed request.
This report is effective for locating localized code or database errors. If the failing URLs share a specific directory, query string parameter, or page template, the 5xx error is likely tied to the application logic rendering those specific pages rather than a site-wide outage.
Visualizing trends with the crawl stats report
For a macro-level view of server capacity and availability, the Crawl Stats report aggregates host responses over a 90-day period. This report tracks total crawl requests, download sizes, and average response times.
The "Host status" section highlights severe server connectivity drops or DNS resolution failures. The "By response" grouping visualizes the daily volume of requests returning 5xx errors. A sudden spike in the 5xx chart typically correlates with a broader infrastructure event, such as an overloaded reverse proxy, exhausted server memory, or an intentional maintenance window.
Interpreting historical data
Data presented in both the Page Indexing and Crawl Stats reports is inherently historical. A 5xx error logged in Search Console confirms that the server failed at the exact timestamp of the crawl, but it does not dictate the server's current status.
A URL flagged with a server error might load normally if the traffic spike or application crash subsided shortly after the crawl. Similarly, an ongoing server outage will not immediately populate in these reports until Googlebot attempts new requests and processes the failure data.
Testing live responses with the URL inspection tool
To verify the current state of a URL flagged for a server error, use the URL Inspection Tool. Submitting the URL and running a live test forces Googlebot to initiate a real-time HTTP request to the origin server.
If the live test successfully retrieves the HTML payload, the prior 5xx error was a transient event. If the live test fails and reports a server error, the backend issue persists and requires immediate investigation before the crawler can process the page.
Correlating errors using log file analysis and APM
Search Console identifies the URL and time a crawler encountered a server failure, but it cannot reveal why the server failed. To isolate the root cause of a 5xx error, server access logs and Application Performance Monitoring (APM) tools must be used in tandem.
Isolating crawl events in server logs
The first step in root cause analysis is locating the specific failed request in the origin server or reverse proxy logs. Access logs record the exact parameters of every HTTP request, allowing you to filter the data for search engine activity.
To find the relevant crawl events, filter the log files using two criteria: the search engine user agent and the specific 5xx HTTP status code. Compare the timestamps of these filtered results against the error reports from your search engine reporting tools.
Because crawlers operate across varying global IP ranges and can generate thousands of requests daily, exact timestamp matching ensures you are analyzing the specific request that generated the crawl error rather than an unrelated user event. Review the resulting log entry to capture the requested URL, the precise response code, and the request duration. For example, an entry returning a 504 status will typically display a request duration exactly matching the server's configured timeout limit.
Identifying backend exhaustion with APM tools
While an access log confirms the request failed, an Application Performance Monitoring tool exposes the internal state of the server at that exact moment. APM platforms track individual application requests, database queries, and server resource metrics.
Take the timestamp and URL from the isolated log entry and search for the corresponding transaction trace within the APM environment. The goal is to identify backend resource exhaustion occurring concurrently with the crawler request.
When investigating a 5xx error trace, evaluate the application for the following conditions:
- Database locks: Long-running or inefficient queries that block the thread needed to generate the requested page.
- Memory spikes: The application exceeding allocated RAM when rendering resource-heavy dynamic views or generating massive XML sitemaps, resulting in an out-of-memory crash.
- Thread pool exhaustion: The server running out of available worker threads during a concurrent traffic spike, causing the application to drop the crawler's incoming connection.
By directly mapping the access log's timestamp to the APM's transaction trace, you can pinpoint the specific process, query, or capacity limit that caused the origin server to fail the crawl attempt.
Bulk Google and Yandex index checker
Verify agency reports and track live SERP status in Google and Yandex to protect your SEO ROI.
Handling temporary outages vs. persistent capacity limits
Distinguishing between an isolated server failure and a systemic resource bottleneck dictates the necessary response. Transient events typically appear in access logs as brief, clustered spikes of 5xx errors. These often align with known administrative events like application deployments, server restarts, or unexpected but brief traffic surges. Once the event passes, the server naturally recovers and resumes serving 200 OK responses.
Systemic bottlenecks manifest differently. A server struggling with persistent capacity limits will generate an ongoing baseline of scattered 500, 502, or 504 errors under normal load. These errors frequently trigger during peak daily operating hours or when search engines crawl computationally expensive routes, such as complex filtered views or large dynamic sitemaps.
Implementing planned maintenance correctly
When taking a server offline for scheduled database migrations or application updates, you can protect indexation by configuring the edge server or reverse proxy to serve a deliberate 503 Service Unavailable status code. A 503 signals that the server is functioning well enough to process the initial routing request but is intentionally refusing to fulfill it due to maintenance.
To implement this correctly, the 503 status must be paired with a
Retry-After
HTTP header. This header instructs search engine crawlers to pause their requests and return later, preventing them from treating the temporary downtime as a permanent application failure. The
Retry-After
header accepts two formats:
-
A specific HTTP date indicating exactly when the server will be available again (e.g.,
Wed, 21 Feb 2024 07:28:00 GMT). -
An integer representing the delay in seconds (e.g.,
3600to instruct the crawler to wait one hour before retrying).
Using this combination ensures that long-term indexation remains stable while the origin application is temporarily offline.
Automated crawl rate reduction
While a properly configured 503 manages crawler expectations during planned downtime, unpredictable 500, 502, and 504 errors signal severe instability. If a hosting environment routinely drops connections, times out behind a load balancer, or crashes due to memory exhaustion, search engines observe a pattern of chronic unreliability.
To avoid causing a complete denial of service on an already struggling server, search engine algorithms are designed to automatically scale back their crawl demand when encountering a high frequency of unexpected 5xx errors. This automated crawl rate reduction persists until the error rate subsides. Because the crawler prioritizes server stability over index freshness, persistent hosting capacity issues directly limit a search engine's ability to discover newly published URLs and process updates to existing content.
Identifying interference from firewalls and DDoS protection
Search engine crawlers can sometimes trigger false positives in security layers, such as Web Application Firewalls (WAFs) or DDoS mitigation services. Because these tools operate as reverse proxies sitting between the open internet and the origin server, they inspect incoming traffic and enforce defensive rules based on request volume, IP reputation, and behavioral patterns.
When a security layer misidentifies a legitimate crawl spike as a volumetric attack or unauthorized scraping attempt, it may apply aggressive rate limiting. In these scenarios, the reverse proxy severs the connection and returns a 502 Bad Gateway or 504 Gateway Timeout error directly to the search engine. This creates a specific diagnostic challenge: the origin application remains fully operational and serves standard responses to regular visitors, but search engine crawlers encounter isolated, persistent server errors.
To prove whether a WAF or CDN is responsible for generating the 5xx errors, compare the access logs from the edge network against the access logs from the origin server. This requires extracting requests made by verified crawler IP addresses during the exact time window the errors were reported.
- If the edge network logs show a 502 or 504 status code for the crawler, but the corresponding request is completely missing from the origin server logs, the security layer intercepted and terminated the connection before it ever reached the application.
- If the request appears in both the edge and origin logs with a 5xx status code, the origin application attempted to process the request and failed, passing the error back upstream through the proxy.
Resolving interference at the edge requires adjusting the WAF or CDN configuration to accurately allowlist verified search engine bots. Most modern DDoS protection services offer managed rulesets designed to automatically validate known crawlers using reverse DNS lookups. Implementing these rules ensures search engines bypass standard rate-limiting thresholds without exposing the origin server to malicious traffic spoofing a legitimate user agent.
Detect stealthy removals, nofollow tag injections, and altered anchors instantly.
Validating resolutions and monitoring recovery
Once the underlying server configuration, capacity bottleneck, or edge network rule is corrected, the next step is confirming the resolution. Because search engine reporting inherently lags behind live server conditions, validation requires a combination of platform signaling and direct log analysis.
To prompt re-evaluation of the affected URLs, use the Validate Fix workflow in Google Search Console. Navigate to the Page Indexing report and select the specific 5xx error category that was addressed. Initiating this workflow does not force an immediate, comprehensive recrawl of every failing URL. Instead, it signals the crawler to prioritize a sample batch of the URLs in question. The validation status transitions to Pending, and the system eventually updates the status to Passed or Failed based on the HTTP responses encountered during the subsequent crawl cycle.
Because the Validate Fix process takes time to complete, immediate verification relies on server access logs. After deploying the fix, monitor incoming requests from verified search engine user agents. Filter the logs by crawler IP addresses and observe the HTTP status codes returned for the previously failing endpoints. A sustained shift from 5xx to 200 OK responses confirms the application is successfully processing requests under the current load.
A successful short-term test does not guarantee long-term stability, particularly if the original errors were triggered by intermittent resource exhaustion or complex database queries. Continuous monitoring is required to ensure the 5xx errors do not return under normal, fluctuating crawl demand.
Track the following signals for several days post-fix:
- Host status availability: Monitor the GSC Crawl Stats report to ensure the host status category remains stable and no new server connectivity drops are recorded.
- Server response times: Track the average download time in Crawl Stats and application monitoring dashboards. If backend response times begin to climb, the server may be approaching a capacity threshold that precedes renewed 503 or 504 errors.
- Error recurrence in logs: Query server logs daily for any scattered 5xx codes returned specifically to search engine user agents, which can indicate edge-case application failures that were not addressed by the primary fix.