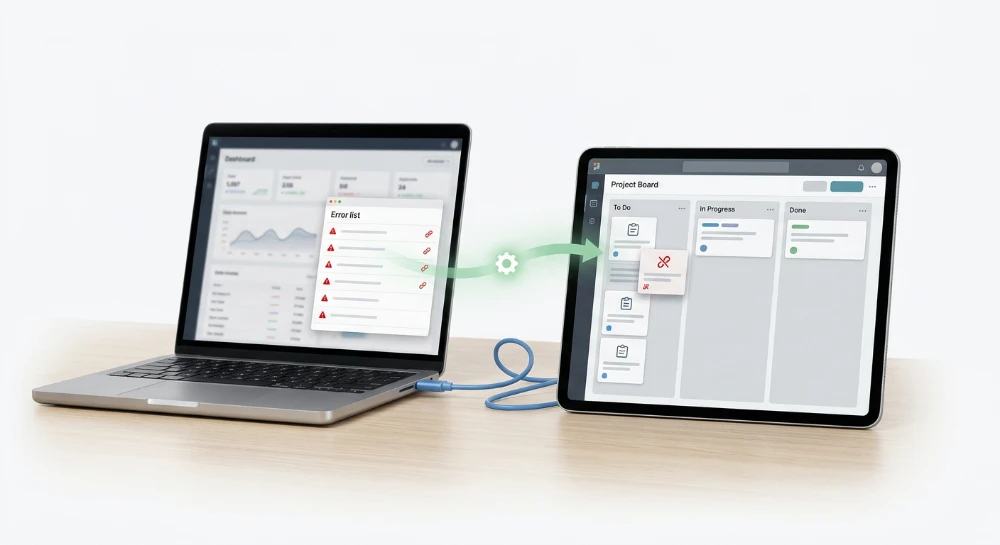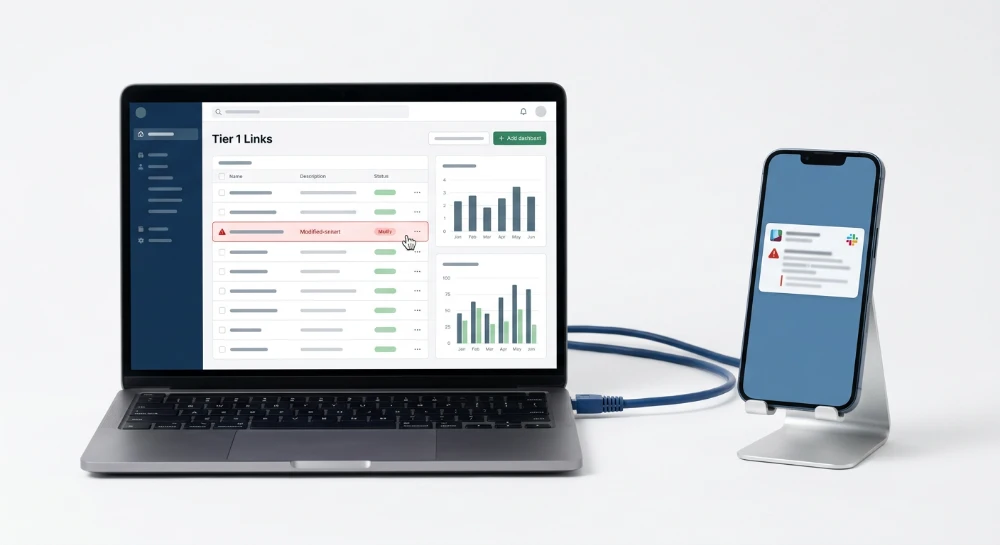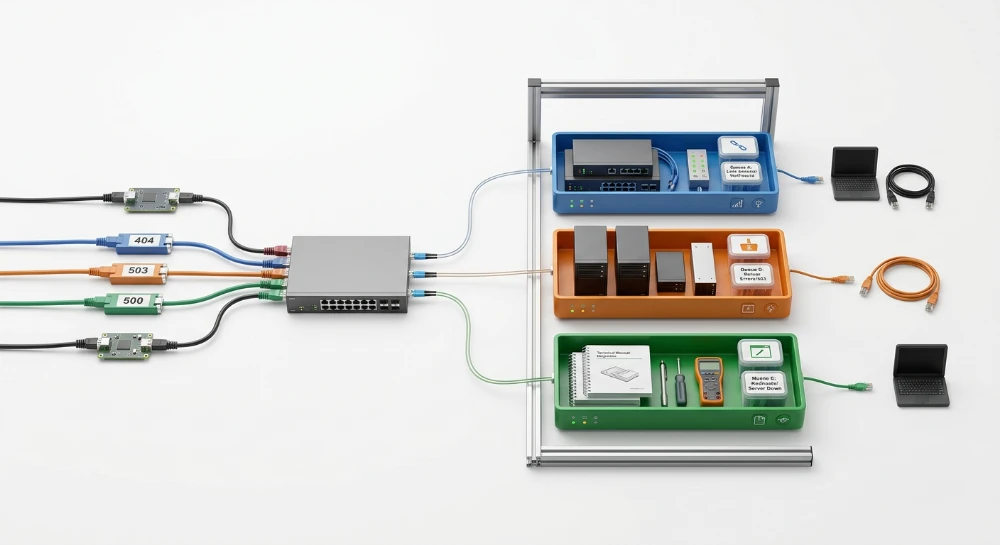
Understanding how error codes of a specific link route to dedicated support queues dictates the speed at which engineering teams resolve server failure states. A manual audit of a 50000 URL architecture requires approximately 14 hours of continuous data extraction. Automated quality assurance architecture eliminates this delay. The system evaluates server status responses in real time and dispatches payload data to engineering environments instantly. Search engines assign strict crawl limits based on server performance. Resolving 500-level server faults and 404 dead ends within minutes prevents crawl budget waste and protects SERP visibility.
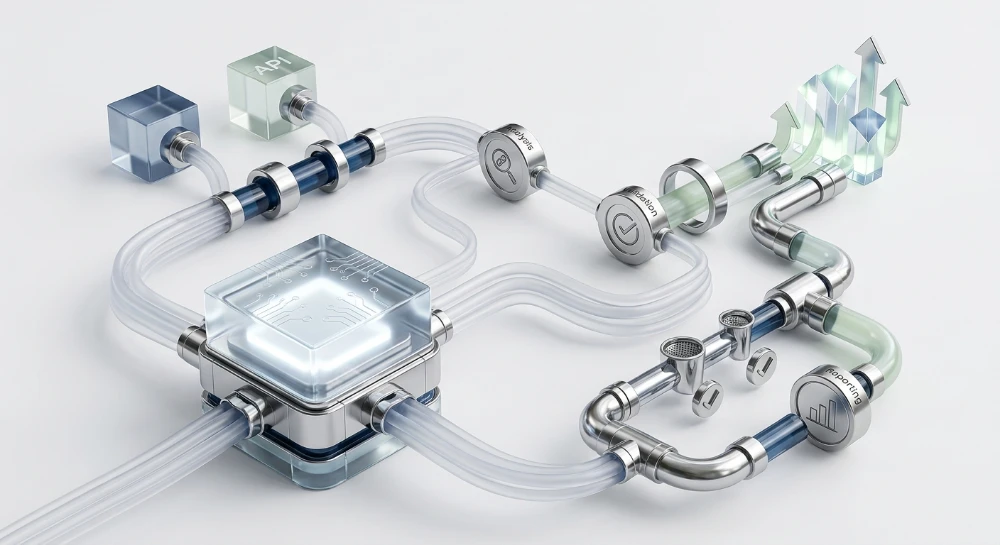
Workflow automation for technical SEO operates entirely through continuous data pipelines.
The system relies on three primary integration layers to transfer incident data without human input.
- API bridges pull live execution data directly from server logs and site crawlers.
- Webhooks push structured data payloads to communication channels like Slack the exact second an error threshold is breached.
- Route handlers format the server request and target the specific Jira or Linear backlog assigned to backend stability.
Link health monitoring logic demands precise conditional rules. Crawlers execute in headless environments to simulate rendering exactly as search bots experience it. The monitoring script captures the header response for every individual URL. Assets returning a 503 status trigger an immediate logic check against the retry-after header. Persistent failures execute a webhook sequence. This sequence drops a structured, pre-formatted ticket onto the active sprint board of the responsible developer. Engineering teams fix the exact line of code causing the failure. Predictable ROI emerges when technical teams stop parsing logs manually and focus entirely on deployment.
Continuous crawl operations and server log parsing configuration
Setting up automated link error detection requires decoupling the crawler from a desktop GUI. Scheduled audits execute directly on virtual machines. You deploy Screaming Frog CLI or Sitebulb headless mode to run validation loops without manual intervention. A standard cron daemon launches the crawler process based on server load cycles. The headless instance fetches a configuration file defining the exact boundaries of the scan.
Screaming Frog CLI accepts command-line arguments to dictate memory allocation and export destinations. Sitebulb headless mode relies on pre-configured project files stored on the server to dictate rendering rules and connection limits.
Crawler configurations define the structure of automated link error detection.
- Screaming Frog CLI Execution: Runs command arguments defining headless execution parameters, target URL paths, and specific export tabs targeting internal link faults.
- Sitebulb Headless Mode: Utilizes task scheduling commands to execute specific project IDs, generating local audit repositories for the integration layer to fetch.
- Resource Allocation: Assigns strict RAM limits to the Java virtual machine to prevent the crawler process from crashing the host server during deep site traversals.
- Custom Extraction: Runs regex patterns against the HTML DOM to capture custom error signatures not covered by standard HTTP status codes.
Server log parsing algorithms
Crawlers only detect broken links present in the rendered HTML. Server logs reveal the exact paths search engine bots actually request. This includes historical assets, orphaned pages, and broken external links pointing to your domain. Parsing algorithms extract this raw request data from the server environment.
Apache and Nginx record access data in fundamentally different structures. Nginx utilizes customizable log formats defined directly in the server block. Apache relies on the standard Combined Log Format by default. The parsing algorithm must normalize these varying structures into a flat tabular format before the data pipeline can route it.
The extraction logic relies on strict regular expressions to isolate specific request fields. The script reads the raw server text file line by line. It evaluates the user-agent string first. Requests originating from known search engine verification IPs pass to the next stage of the script. The algorithm then extracts the requested path, the server status code, and the response size.
Standard log parsing configuration dictates specific field extraction rules for different server architectures.
| Web Server Environment | Log Format Variable | Parsing Algorithm Target |
|---|---|---|
| Nginx | $request_uri | Extracts the exact URL path requested by the bot. |
| Nginx | $status | Captures the numerical HTTP response returned by the server. |
| Apache | %U | Isolates the URL path excluding the domain name and query string. |
| Apache | %>s | Records the final status code of the request after internal redirects process. |
Defining crawl health baselines
Raw error counts hold no analytical value without historical context. Continuous monitoring systems require strictly defined parameters for crawl health baselines. These baselines establish the normal operating state of the web application.
You must configure the monitoring script to calculate a rolling average of structural defects over a standard reporting period. Baseline parameters rely on proportional metrics rather than absolute volume.
Crawl health baselines track specific technical proportions.
- Internal Link Failure Rate: The percentage of internal HTML links returning non-200 status codes measured against the total volume of extracted URLs.
- Bot Encountered Faults: The ratio of server failure responses served specifically to verified search engine user agents compared to successful fetches.
- Average Fetch Duration: The median time required for the server environment to return the initial document payload to the crawler.
Deviations from these baseline parameters indicate an architectural flaw. A site exceeding its historical internal failure rate threshold by a predefined multiplier triggers the system. The incident routing script compares the current crawl execution data against these baseline parameters before initiating any downstream sequence. This conditional logic stops temporary server latency from flooding engineering queues with invalid reports.
HTTP status code categorization and severity threshold definitions
Treat server responses as triage data. A flat list of non-200 responses provides no operational direction. Categorization protocols dictate whether a detected anomaly hits a standard maintenance backlog or immediately interrupts an engineering team.
Classifying HTTP status codes requires strict isolation of client-side request failures from server-side execution failures. The parser evaluates the raw response headers before applying specific structural logic.
Failure states and detection logic
Accurate incident routing depends on distinguishing the exact nature of the failure state. Crawl engines evaluate five primary categories of response errors.
- 404 errors: The server cannot find the requested resource. Isolated occurrences point to outdated content references. A sudden spike across specific URL structures indicates a dropped database table or a failed CMS routing rule.
- Soft 404s: The server returns a 200 OK header, but the document lacks the requested content. Detection relies on evaluating the DOM payload. The script must scan for exceptionally low word counts, empty primary content containers, or specific CSS selectors native to the site's "not found" template.
- 500 status code: Internal server errors denote critical execution failures. The server encountered an unexpected condition preventing it from fulfilling the request. This often occurs when server-side scripts crash during HTML generation.
- 503 errors: Service unavailable. The server is currently unable to handle the request due to temporary overloading or scheduled maintenance. Sustained 503 responses confirm traffic volumes are exceeding allocated server connection pools.
- Timeout errors: The gateway fails to receive a timely response from the upstream server. The crawler closes the connection after a predefined threshold. Unoptimized database queries or external API dependencies blocking the render path typically cause these latency failures.
Routing anomalies and conflict identification
Beyond distinct status codes, the logic must evaluate the sequence and destination of URLs. Misconfigured directives destroy crawl efficiency and confuse SERP indexing.
Redirect chains waste connection time. A URL initiates sequential jumps before landing on the final destination. The parser logic flags any sequence exceeding two consecutive hops. Long chains dilute ranking signals and increase the probability of a dropped fetch.
Redirect loops create infinite request cycles. URL A points to URL B, which points back to URL A. The crawler hits the maximum redirect limit and abandons the request entirely. The system must immediately categorize this as an architectural blockage.
Canonical conflicts generate severe indexing discrepancies. The HTTP header declares one canonical target, while the HTML head specifies a different URL. The script must compare HTTP header link tags against the DOM payload to catch these misalignments. Another conflict occurs when a page canonicalizes to a destination returning a 404 or a redirect. The monitoring logic queries the destination of every canonical tag to verify a 200 OK response.
Severity thresholds
Not every broken link requires an immediate technical response. Assigning severity thresholds isolates minor content rot from systemic server failures.
| Severity Level | Defect Category | Trigger Condition | System Action |
|---|---|---|---|
| Tier 4 (Low) | Isolated broken link detection | Less than 0.5% of internal links returning 404 over a 7-day period. | Log to standard SEO maintenance queue. |
| Tier 3 (Medium) | Canonical conflicts / Redirect chains | Structural mismatch localized to a specific CMS template. | Flag for upcoming technical sprint review. |
| Tier 2 (High) | Systemic 404 spike / Soft 404s | Greater than 3% of known URL inventory drops from 200 OK to 404 within a single crawl. | Escalate to core engineering for immediate routing review. |
| Tier 1 (Critical) | 500 status code / 503 errors / Timeout errors | Consecutive server faults exceeding 1% of total crawl requests. | Trigger immediate server administration response protocol. |
These thresholds demand rigid adherence. Triaging based on absolute numbers rather than proportional thresholds guarantees alert fatigue. A 500 status code on an isolated legacy post requires a different response than a 500 status code paralyzing an entire product category. The system evaluates the trigger condition against the total URL volume before assigning the severity tier.
Webhook architecture and API gateway data routing
The detection phase ends when the crawler completes its cycle and assigns the severity tiers. The system must now move this raw data across the network to the relevant notification endpoints without dropping packets or overloading downstream receivers. A centralized API acts as the ingestion point for all crawl data. This prevents local server scripts from executing fragile point-to-point connections directly to third-party notification channels.
HTTP API deployment and API GW configuration
Deploying a dedicated HTTP API requires a proxy layer capable of handling heavy burst traffic during massive crawl completions. The API GW intercepts the incoming data dump. It validates incoming payloads before passing them to internal routing services. Enforcing strict schema validation at the gateway level is mandatory. Any malformed crawler output gets rejected with a 400 HTTP response before consuming processing cycles.
Technical requirements for stable API Integrations dictate several non-negotiable gateway configurations:
- Mutual TLS authentication for secure crawler-to-gateway communication.
- HMAC signature validation to reject payload spoofing attempts.
- Rate limiting policies configured dynamically based on the maximum expected crawl export batch size.
- Dead-letter queues mapped to cloud storage to capture unprocessable transmission failures for later inspection.
Traffic throttling at the API GW protects the underlying Route Handlers from memory exhaustion. Crawl operations running across millions of pages generate immense JSON objects. The gateway must slice these massive payloads into manageable chunks before pushing them down the pipeline.
Route handlers and JSON formatting
Once the API GW accepts the payload, Route Handlers take over network transmission. These serverless functions evaluate the severity tier assigned during the initial crawl phase. The handler reads the JSON object and dynamically maps it to the correct destination webhook. Tier 1 events bypass standard batching and trigger immediate synchronous processing.
The crawler must serialize its output into a lean, standardized JSON format. Extraneous metadata wastes bandwidth and inflates execution time. The payload schema must contain only actionable routing vectors.
{
  "audit_id": "c59d2b8f-1a9e",
  "timestamp": "2023-10-27T08:14:32Z",
  "defect_url": "https://example.com/checkout",
  "http_status": 503,
  "severity_tier": "Tier 1",
  "trigger_condition": "Consecutive server faults",
  "source_ip": "192.168.10.55"
}
Route Handlers parse this JSON structure in milliseconds. If the
severity_tier
key equals Tier 1, the handler opens a direct socket to the critical response endpoint. If the value reads Tier 3, the handler routes the data to a distributed message queue for eventual processing during the next operational window.
Routing to slack and PagerDuty endpoints
The final stage of the webhook architecture involves pushing normalized data to external operational systems. Route Handlers translate the internal JSON schema into the specific proprietary payload structures required by Slack and PagerDuty APIs.
| Endpoint Destination | Target Severity | Payload Transformation Logic | Delivery Protocol |
|---|---|---|---|
| PagerDuty Events API | Tier 1 (Critical) |
Maps internal
audit_id
to the PagerDuty
dedup_key
. Sets urgency parameter to high.
|
Synchronous POST request with strict timeout thresholds. |
| Slack Webhook (Engineering) | Tier 2 (High) |
Translates raw JSON into Slack Block Kit formatting. Highlights the
defect_url
and
http_status
in red text blocks.
|
Asynchronous POST request via standard HTTPS. |
| Slack Webhook (SEO QA) | Tier 3 (Medium) / Tier 4 (Low) | Aggregates multiple URLs into a single comma-separated text block. Uses default message attachments. | Asynchronous POST request executed at the end of the crawl cycle. |
PagerDuty integration requires absolute payload precision. The Route Handler must include routing keys that correspond to the specific on-call engineering rotation. A 500 status code triggers a different PagerDuty service than a database timeout. Slack endpoints require less rigid routing but demand high readability. The webhook payload maps the raw HTTP status integers to human-readable server fault descriptions using Slack Block Kit elements, ensuring engineers understand the system failure instantly upon viewing the channel.
Ticket orchestration and CI/CD pipeline integration
Chat alerts vanish into channel history. Systemic resolutions require persistent tracking. Ticket orchestration binds automated crawl data directly into engineering workflows. Every detected defect must translate into a sprint-ready task without manual triage. The orchestration layer evaluates the incoming webhook payload, structures the defect data, and executes API commands against issue tracking systems.
Ticket orchestration parameters
Generating actionable tickets requires strict payload parameterization. Pushing raw system output into a ticket description guarantees it will be ignored by development teams. The payload must map structural defect data to native issue tracking fields.
- Project Mapping logic parses the URL path segment to assign the correct workspace. A technical error in the `/checkout/` directory maps automatically to the Payments team project key.
- Severity Translation converts HTTP status categories into tracker priority levels. Systemic database timeouts become immediate blockers, while isolated missing tags enter the general backlog.
- Environment Tagging distinguishes between staging environments and live production deployments. CI variables inject this context directly into the ticket schema.
- Formatting Protocols ensure data renders correctly in the target CMS or issue tracker. Specific JSON structures adapt to Atlassian Document Format or raw markdown depending on the destination system.
API commands for jira and linear queues
Direct API integration eliminates middleware bottlenecks. Custom serverless functions execute POST requests to generate structured issues instantly. A sprint-ready Jira task requires a precise JSON payload sent to the
/rest/api/3/issue
endpoint.
{
  "fields": {
    "project": { "key": "SEOQA" },
    "summary": "Critical: 503 Error on Core Category Path",
    "description": {
      "type": "doc",
      "version": 1,
      "content": [
        {
          "type": "paragraph",
          "content": [
            { "type": "text", "text": "Endpoint returned 503 during automated post-deploy validation." }
          ]
        }
      ]
    },
    "issuetype": { "name": "Bug" },
    "customfield_10011": "backend-routing-failure"
  }
}
Linear operates via GraphQL schemas. Generating a ticket requires a mutation command pointing to the
issueCreate
endpoint. The POST payload injects the correct team identifier, parses the broken URL into the title block, and assigns a specific triage state. The API response returns the newly minted ticket URL, which the orchestrator then forwards to the Slack channel.
Routing logic varies based on the destination queue and the nature of the detected architectural flaw.
| Defect State | Target System | API Payload Specification | Queue Assignment |
|---|---|---|---|
| Systemic 500 Errors | Jira |
Sets
priority
to Highest. Injects full server response headers into a code block component.
|
Dedicated Technical Support Queue (Active Sprint) |
| Missing Canonical Tags | Linear |
Sets
state
to Triage. Appends the specific URL and expected tag format in markdown format.
|
SEO Technical Backlog |
| Staging Redirect Loops | GitLab Issues | Appends the specific CI pipeline execution ID. Tags the author of the latest commit. | Pre-Release Blocking Queue |
Pipeline steps in GitHub actions and GitLab CI
Post-release bugs cost exponentially more to fix than pre-release bugs. Integrating automated QA directly into the deployment pipeline prevents broken routing logic from reaching production. The pipeline execution sequence determines exactly when these validation audits trigger.
GitHub Actions relies on explicit job dependencies. The staging deployment job must complete before the validation container spins up. The runner triggers the audit script, captures the JSON output, and evaluates the exit codes. A non-zero exit code halts the deployment and fails the workflow.
jobs:
  seo_qa_audit:
    needs: deploy_staging
    runs-on: ubuntu-latest
    steps:
      - name: Checkout Code
        uses: actions/checkout@v3
      - name: Execute Headless Validation
        run: ./scripts/validate-routes.sh --env staging
      - name: Parse Output and Generate Tickets
        if: failure()
        run: node ./scripts/orchestrate-tickets.js
GitLab CI manages these workloads through strict stage definitions. You define a
post-deploy-test
stage. The runner executes the validation suite against the newly deployed environment. If the script detects structural anomalies, the pipeline halts immediately.
Routing critical Post-Release bugs
Pipeline failures demand immediate action. If a deployment succeeds but the subsequent post-release audit detects critical failure states, the orchestration logic bypasses the standard sprint backlog entirely.
The route handler evaluates the severity of the failure state. A massive traffic drop caused by a misconfigured load balancer triggers an emergency routing protocol. The API pushes these specific defects directly to dedicated technical support queues. The ticket bypasses the triage board, assigns directly to the active release manager, and flags the issue for immediate hotfix deployment.
This strict segmentation protects engineering velocity. Developers process minor technical debt asynchronously from the standard backlog. Major architectural flaws generated by a recent commit trigger immediate blockages, forcing a deployment revert or an emergency patch before search engines index the system failure.
Alert deduplication algorithms and Auto-Remediation triggers
A massive infrastructure failure can generate thousands of individual broken links within minutes. Passing unfiltered crawler payloads directly to the ticketing API guarantees immediate alert fatigue. Support queues flood with duplicate issues. Engineering responsiveness drops.
The deduplication logic intercepts the raw crawler output before it reaches the ticket generation layer. It evaluates incoming data against active incident states. The system applies cryptographic hashing to each detected failure to create a unique incident signature.
const incidentHash = crypto.createHash('sha256').update(`${targetURL}-${statusCode}-${sourcePath}`).digest('hex');The orchestration script queries the active backlog for this specific hash. If a ticket exists and remains in an unresolved state, the script drops the duplicate payload. The system logs the recurrence internally but suppresses any external notification.
Incident aggregation and batching parameters
Systemic failures rarely occur in isolation. A misconfigured database query might trigger identical 500 status codes across an entire product category. Emitting single alerts for each URL is highly inefficient. The middleware must cluster related anomalies into master incidents based on strict batching parameters.
The script monitors the event stream over a defined time window. It applies pattern matching to the URL structures returning error codes.
| Aggregation Parameter | Evaluation Logic | Queue Output |
|---|---|---|
| Directory Threshold Breach | Multiple distinct URL failures detected sharing the same parent path segment within a rolling window. | Generates a single master ticket indicating a localized directory failure. Suppresses individual URL alerts. |
| Status Code Bursting | High volume of identical server faults across disjointed URL paths within a five-minute interval. | Triggers a systemic failure alert. Escalates directly to the on-call site reliability engineer. |
| Template Syntax Errors | Consistent parsing failures localized entirely to pages sharing a specific CMS layout identifier. | Assigns a batched defect ticket to the frontend engineering queue, bypassing general support. |
This batching architecture protects the integrity of the project management software. It transforms chaotic event floods into actionable, structured engineering tasks.
Auto-Remediation triggers for server faults
Human intervention introduces latency. Certain technical errors follow predictable diagnostic and resolution paths. Auto-remediation executes predefined operational runbooks against the server infrastructure the moment the monitoring logic validates a specific error signature.
The route handler parses the incoming webhook. It bypasses ticket creation entirely if the payload matches an approved remediation schema.
Standard auto-remediation routines execute specific commands based on the validated error signature.
- Transient 502 Bad Gateway responses detected on a specific reverse proxy route trigger a localized container restart via orchestration webhooks.
- Soft 404s caused by edge cache desynchronization prompt an immediate API call to the content delivery network to purge the affected URL nodes.
- Resource exhaustion timeouts invoke a script to temporarily scale up concurrent connection limits for the isolated service block.
- Missing static assets generating 404s post-deployment trigger the injection of standardized fallback routing rules within the Nginx configuration block.
The auto-remediation script executes the fix. It then forces a localized, headless crawl against the affected URL array to validate the result. If the crawler receives a 200 OK response, the system logs the incident as automatically resolved and terminates the workflow. Manual support tickets generate only when the automated runbook fails to restore structural integrity.
Analytics, Time-to-Fix metrics, and indexability regression tracking
Automated workflows require quantifiable baseline metrics to measure system health. The core SEO QA dashboard relies on two primary data points: Time-to-fix and raw crawlability rates.
Time-to-fix calculates the exact duration between the initial error detection payload and the successful validation crawl. Engineering teams track this metric to ensure technical bottlenecks do not persist long enough to trigger search engine deindexing cycles. High-priority server faults demand rapid containment. Lower severity client errors tolerate slightly longer resolution windows. Rapid Time-to-fix metrics directly correlate with preserved search visibility.
Crawlability rates measure the percentage of valid 200 OK responses against the total URL batch processed during the execution phase. A healthy architecture maintains these rates near absolute perfection.
Uptime validation parameters operate independently of standard load balancers. Monitoring scripts ping critical sitemaps and high-value canonical targets at designated intervals. They do not merely verify network availability. The logic validates the presence of the required HTML DOM structure. An empty 200 OK response represents a failure state. True uptime requires strict rendering parity.
Google search console API integration
Resolving errors at the server level does not instantly restore search visibility. The Google Search Console API serves as the validation layer to detect indexability regressions.
Custom scripts query the URL Inspection API to extract live index status across the previously affected segments. The system maps the returned coverage data against internal error logs.
| API Response Parameter | Diagnostic State | Operational Action |
|---|---|---|
| Submitted and indexed | Normal | Archive ticket and close workflow |
| Crawled currently not indexed | Quality evaluation failure or soft regression | Queue URL for content review and forced recrawl |
| Discovered currently not indexed | Crawl budget exhaustion or architectural bottleneck | Assess server log volume for crawl efficiency |
| Not found 404 | Indexability regression confirmed | Execute API ping to force indexing request |
The integration runs automated batch queries specific to the URLs involved in recent incidents. Drops in indexed status trigger a secondary alert sequence. The system pushes these regression reports directly to the technical SEO queue for manual review.
Link equity preservation logic
Broken link remediation must prioritize SEO Equity. Not all dead pages carry equal weight. The analytics engine cross-references the server logs with external backlink profiles via external API queries.
A script maps incoming referrers against the failing routes.
- The logic intercepts failed requests carrying active external link signals.
- High-authority dead pages bypass the standard queue and escalate immediately.
- The system automatically drafts a targeted 301 redirect mapping to the closest topical equivalent.
- Low-value orphaned pages with zero external referrers receive standard 404 status without generating critical alerts.
This tracking logic ensures structural integrity while preventing the slow bleed of authoritative signals. The infrastructure isolates valuable entry points. System logic overrides generic routing rules to salvage external equity before search crawlers update the index graph.