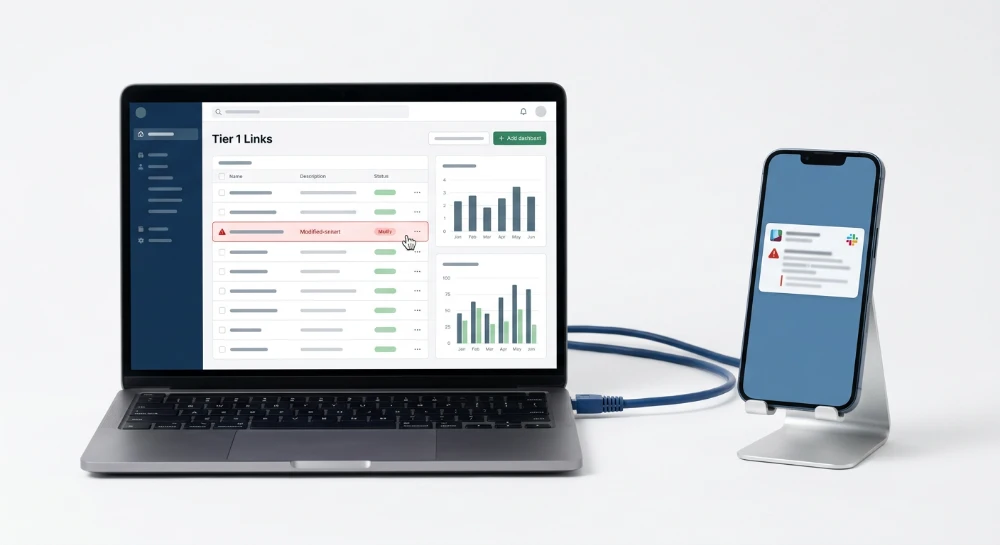
Understanding why modifications of tier one links trigger critical alerts in Slack requires a direct analysis of backlink equity flow algorithms like PageRank. Tier one backlinks point directly to primary domain conversion pages, where a sudden HTTP 404 status code or the injection of a rel="sponsored" attribute immediately halts ranking signals. Cron jobs executing Python scripts every 15 minutes dictate incident response capabilities. Setting up an event-driven notifications pipeline links a custom SEO Checker API with the Slack API through JSON payloads sent via POST requests, reducing detection time from 30 days in Google Search Console to under five minutes.
Baseline parameters for real-time notifications demand a server timeout threshold of 5000 milliseconds during the execution of HTTP GET requests against referring domains. The URL monitoring infrastructure validates the exact byte count of the fetched document to detect unauthorized structural shifts in the DOM tree, matching missing href attributes against a strict binary severity matrix.
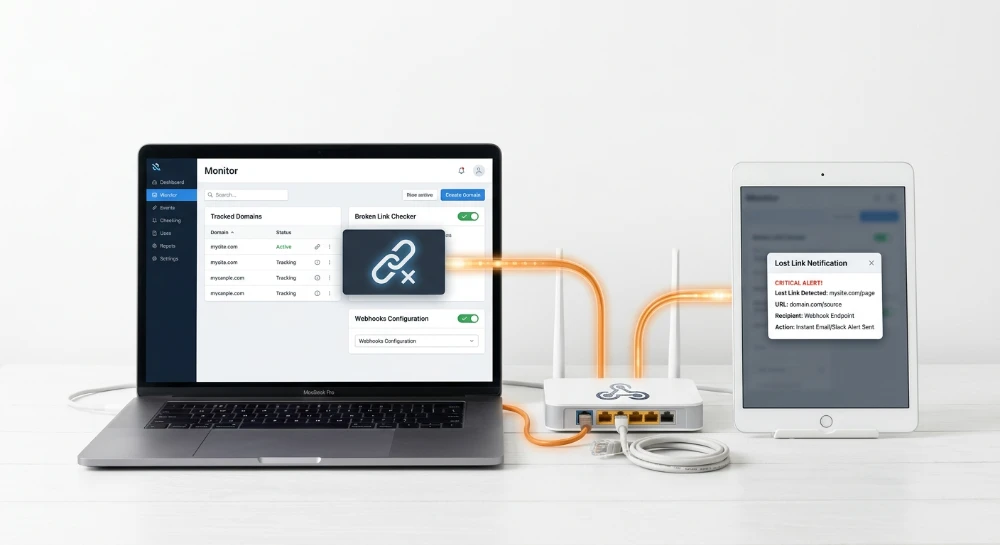
An active monitor relies on a Node.js backend to parse HTML responses using libraries like Cheerio to calculate exact tag mismatch percentages. If an outbound link drops its rel="dofollow" directive, the SEO Checker API structures a data block containing the exact Unix timestamp, the referring IP address, and the compromised target page. The Slack API accepts this incoming webhook connection over port 443. Teams immediately receive incident reports directly in their workspace, bypassing the 48-hour indexation delay associated with external commercial web crawlers like AhrefsBot or Googlebot.
Defining trigger events for tier one link modifications
The core monitoring logic relies on synchronous data handoffs between the SEO Monitor API and the SEO Checker API. The SEO Monitor API handles execution scheduling, pinging target endpoints across distributed geographic nodes. When a fetched response deviates from the stored baseline footprint, it passes the payload to the SEO Checker API for granular DOM inspection. This real-time data exchange protocol utilizes persistent keep-alive connections. It streams raw document buffers directly to backend evaluation modules, eliminating polling bottlenecks and preventing stale cache delivery.
Audit thresholds dictate the line between a logged anomaly and a critical system failure. Setting strict boundaries prevents alerting fatigue.
Configuring specific trigger events
Detecting tier one link degradation requires isolating specific technical shifts in the target environment. Systems must evaluate the HTTP layer and the rendered HTML document concurrently to capture covert modifications that bypass basic uptime checks.
| Trigger Event Classification | Technical Signature | Evaluation Logic |
|---|---|---|
| HTTP Status Code Shifts | Transition from 200 to 3xx, 4xx, or 5xx | Parses response headers prior to downloading the payload body to detect routing changes or server errors. |
| Canonicals Modification | Altered href attribute within rel="canonical" tag | Scans the document head block for exact string matching against the previously validated canonical URL. |
| Structural Changes | DOM node path deviation or CSS class updates | Calculates element depth and sibling node proximity to confirm the link remains in the primary editorial wrapper. |
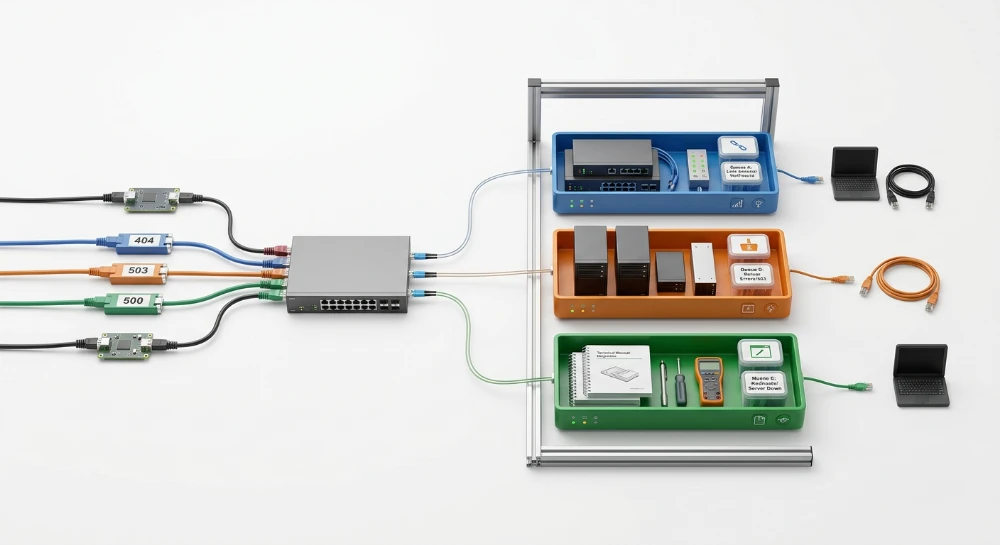
HTTP status code shifts demand immediate classification. A transition from a standard 200 OK to a 301 redirection might appear benign, but altering the destination URL breaks the precise link equity flow. The SEO Monitor API flags any 4xx client errors or 5xx server failures instantly. If a 302 temporary redirect appears, the system flags an architectural flaw, as temporary routing prevents search engines from consolidating ranking signals to the final destination.
Canonicals modification presents a stealthier threat. A referring domain might maintain the physical link in the HTML while silently injecting a self-referencing canonical tag on the page, or pointing it to an orphaned URL. The parser targets the exact markup structure. If the referring page suddenly declares a different canonical version, the authority passed through the outbound link drops to zero.
Structural changes involve DOM tree manipulation. If a webmaster moves a tier one link from the primary editorial article tag into a global footer or aside block, the link loses contextual weight. The script measures the exact XPath to the anchor text. Modifications to surrounding div wrappers, injection of display:none CSS rules, or wrapping the link in client-side JavaScript execution blocks all constitute structural failures.
Establishing audit thresholds
To configure trigger events accurately, the system applies layered audit thresholds to filter out transient network issues from actual deliberate modifications.
- Network Latency Threshold: Require two consecutive failed HTTP GET requests spaced 30 seconds apart before confirming a status code shift, bypassing false positives from temporary CDN routing delays.
- DOM Variance Threshold: Permit minor HTML attribute variations, such as appended UTM parameters, but execute a hard failure if the absolute node path or the anchor text string length changes by more than a defined character count.
- Canonical Persistence Check: Trigger a critical alert immediately upon detecting a mismatched canonical href value. Do not queue this for retry, as search engine crawlers process canonical instructions upon the first successful fetch.
The SEO Checker API evaluates these parameters against the stored baseline database. If a condition breaches an established threshold, the system packages the differential data for output routing.
Configuring the slack application and authentication protocols
Routing differential data requires a dedicated bot user provisioned within the target workspace. Navigate to api.slack.com/apps and instantiate a new application from scratch. Assign it a discrete name that server administrators will immediately recognize in system logs. Attach the application to the specific workspace where the SEO team manages incident resolution.
The bot operates strictly on the permissions granted during initialization. Over-provisioning access scopes introduces severe architectural flaws. Limit the application capabilities exclusively to message transmission. Navigate to the OAuth & Permissions interface within the application dashboard. Inject the required granular user tokens under the Bot Token Scopes matrix.
-
chat:writegrants the bot user authorization to transmit text strings into designated channels. -
incoming-webhookprovisions the distinct application permissions required to accept external payloads without requiring full workspace traversal.
Executing the OAuth authorization flow binds the application to the workspace. Initiate the installation protocol. The system executes a secure user authentication handshake and returns the
access_token
. This string acts as the primary cryptographic key for the bot. Treat this token as a critical infrastructure credential.
Exposing the
access_token
in version control repositories compromises the entire workspace architecture. Establish strict secrets management protocols immediately upon generation. Pass credentials to the execution environment using dedicated environment variables rather than hardcoded configuration files.
Server administrators must map the environment configuration precisely to ensure secure credential isolation at runtime.
| Variable Key | Value Format | System Function |
|---|---|---|
| SLACK_BOT_TOKEN | xoxb-alphanumeric-string | Authenticates the backend script against the API |
| SLACK_CLIENT_ID | alphanumeric-string | Identifies the application during the OAuth authorization flow |
| NODE_ENV | production | Restricts output verbosity during live script execution |
System failures frequently occur when background execution processes run under different user profiles that lack access to the protected environment files. Validate read permissions for the server user executing the script pipeline. Securing the authentication handshake strictly isolates the monitoring infrastructure from unauthorized external modifications.
Establishing webhook endpoints and HTTP POST requests
System architects must choose between two distinct data transmission protocols for Slack integration: Incoming webhooks and the chat.postMessage API. The decision dictates the flexibility of your channel routing logic.
Incoming webhooks provide a static Webhook endpoint URL tied explicitly to a single destination. This method reduces configuration overhead but creates architectural rigidity. Generating an incoming webhook yields a unique URL that accepts data without requiring an authorization header. The routing logic is inherently baked into the URL string itself. The chat.postMessage API requires the previously generated token and allows the backend HTTP client to dynamically route alerts across multiple channels by simply changing the destination identifier in the request body.
| Transmission Protocol | Routing Capabilities | Authentication Method | Ideal Use Case |
|---|---|---|---|
| Incoming Webhooks | Static | URL-embedded identifier | Isolated notification streams |
| chat.postMessage API | Dynamic | Bearer token in header | Complex SEO alert matrices |
Constructing the HTTP POST request
Servers must initiate an HTTP POST request to transmit the monitoring data. Slack outright rejects GET requests for message publication. The transmission requires strict adherence to network protocol standards to prevent dropped alerts.
Configure your HTTP client to declare the Content-type: application/json header explicitly. Omitting this header forces the endpoint to process the incoming data as plain text, resulting in a parsing error and a failed request. The webhook payload must operate as a properly serialized JSON object.
POST /services/T00000000/B00000000/XXXXXXXXXXXXXXXXXXXXXXXX HTTP/1.1
Host: hooks.slack.com
Content-type: application/json

{"text": "System event registered for monitored URL"}
Backend integrations demand a reliable HTTP client capable of managing connection timeouts and network latency. Native libraries within your server environment execute these requests seamlessly without introducing third-party application dependencies. Define the webhook payload strictly based on the variables extracted from the monitoring script.
Payload normalization and endpoint routing
Unsanitized data triggers system failures during the JSON serialization phase. Execute payload normalization before the HTTP client initiates the POST request. This process strips invalid characters, escapes quotation marks, and handles null values returned by the monitoring infrastructure.
A missing canonical tag returning a null value will break the entire data structure if not normalized into an empty string or omitted entirely.
- Stringify the data object natively to catch structural anomalies prior to transmission
- Sanitize special characters within URL paths to prevent escape character conflicts
- Audit the payload byte size against platform limitations to avoid truncation
Validate API endpoint routing logic prior to deployment. Hardcoding the Webhook endpoint URL across multiple functions creates a massive maintenance bottleneck. Store the endpoint URL centrally and reference it dynamically during script execution. When utilizing the chat.postMessage API, the routing logic must map the severity of the alert to the appropriate channel ID. This ensures critical HTTP status code shifts trigger alerts in engineering channels while minor structural modifications route cleanly to the SEO team.
Structuring the JSON payload with slack block kit
Flat text strings fail to convey incident hierarchy during a critical URL failure. Construct the JSON payload utilizing Block Kit UI components to enforce strict visual architecture. This modular JSON framework replaces legacy message attachments and guarantees deterministic rendering across all client applications.
Format layout blocks to separate diagnostic variables from execution metadata. A standard engineering alert requires a header block for the incident severity, a section block containing the primary array of field objects, and a divider block to visually isolate raw data. Implement mrkdwn formatting within the text objects to parse dynamic system variables natively.
Variable mapping and metadata assignment
Map application variables to text fields programmatically during the payload construction phase. When a tier one link shifts from HTTP 200 to HTTP 404, the JSON payload must isolate the affected URL, the prior canonical state, and the current state into dedicated columns. Injecting raw log data without structural mapping causes layout overflow.
| Block Type | Component Function | Application Variable Mapping |
|---|---|---|
| header | Incident classification | Alert severity level and HTTP status code |
| section | Core diagnostic arrays | Target URL and specific canonical mismatch parameters |
| context | Execution metadata | Monitoring node ID and crawler latency |
| actions | Triage acceleration | Direct routing links to the affected CMS node |
Define context_messages within the payload array to append supplementary diagnostic data without consuming the primary viewport. The context block accepts a mixed array of image elements and text objects. Pass timestamp data, the execution environment, and the active monitoring script version directly into this block. This granular metadata isolates localized routing dropouts from global server outages.
Structure interactive components to shorten the feedback loop during sudden SERP volatility. Inject an actions block containing button elements linked directly to the staging environment or internal logging dashboards. Triage engineers bypass manual query construction when direct navigation links are embedded adjacent to the fault data.
Alert aggregation via threading protocols
Cascading link failures generate unacceptable channel noise. A single faulty database migration altering site-wide URL structures triggers hundreds of isolated POST requests simultaneously. Group these alerts programmatically using thread protocols to maintain channel legibility.
- Capture the exact timestamp string from the initial parent message API response
- Store the timestamp temporarily within the active script execution instance
- Format thread_ts for conversations.replies by injecting this exact string into subsequent payload requests
Passing the thread_ts parameter forces the API to append related alerts as nested replies under the original incident notification. This architectural decision prevents channel dilution while preserving the complete chronologic log of the HTML structural changes detected by the monitoring infrastructure. Main channel visibility remains focused on distinct root incidents rather than identical repetitive system triggers.
Implementing payload security and signature verification
Open endpoints invite abuse. When triage engineers interact with the diagnostic buttons embedded in the incident payloads, the API transmits a POST request back to the internal server infrastructure. Verifying the authenticity of these incoming requests prevents malicious actors from triggering unauthorized scripts or altering operational statuses.
Exposed receiving endpoints present a severe architectural flaw without cryptographic validation. Execute Slack Signing Secret validation to confirm the origin of every incoming request interacting with your system.
Parsing HTTP headers and temporal validation
Extracting specific metadata from the HTTP headers initiates the security pipeline. The incoming payload contains two critical headers required for validation. Parse HTTP headers to read X-Slack-Signature and X-Slack-Request-Timestamp directly from the request object before initiating any parsing logic.
Implement temporal checks immediately to prevent Replay Attacks. Malicious actors intercepting legitimate requests will attempt to resend the exact payload to trigger duplicate system actions. Compare the integer value of X-Slack-Request-Timestamp against the current UNIX epoch time of the receiving server. Calculate the absolute difference between these two values. Drop the request entirely if the difference exceeds five minutes.
Header validation criteria
Implement strict validation checks across these targeted HTTP headers to secure the receiving endpoint.
| Header Target | Validation Purpose | Failure Action |
|---|---|---|
| X-Slack-Request-Timestamp | Prevent Replay Attacks | Reject request if timestamp exceeds current UNIX epoch by 300 seconds |
| X-Slack-Signature | Cryptographic Authentication | Drop connection if computed hash mismatches transmitted hexadecimal digest |
| Content-Type | Define Payload Structure | Halt processing if value deviates from application/x-www-form-urlencoded |
Computing the cryptographic hash
The API never transmits the signing secret over the network. It uses the secret to generate a cryptographic hash of the payload payload prior to transmission. The receiving server must independently compute this hash and compare it against the provided X-Slack-Signature header.
Compute X-Slack-Signature by following a strict concatenation sequence.
- Capture the raw request body exactly as it arrived without any character modification
- Construct a base string by combining the version number v0, a colon, the timestamp header, another colon, and the raw request body
- Execute an HMAC SHA256 hash on this base string utilizing the designated signing secret as the cryptographic key
- Prepend the string v0= to the resulting hexadecimal digest
Compare this computed signature against the X-Slack-Signature header. Utilize a constant-time string comparison function to evaluate the match. Standard equality operators fail here because they terminate early upon detecting a character mismatch. This early termination opens a vector for timing attacks.
Managing credentials and request patterns
Never hardcode the signing secret within the application logic. Utilize Secrets Management for credentials to inject sensitive keys into the execution environment at runtime. Isolate these variables from source control repositories to maintain deployment security across development and production environments.
Validate Request/response pattern rules to maintain connection stability. The API requires an explicit acknowledgment for all interactive payloads. Return an HTTP 200 response immediately after signature validation succeeds. Secure custom code execution for diagnostic scripts or database queries asynchronously after dispatching this acknowledgment. Failing to respond within three seconds triggers timeout protocols. This causes the API to present a failure warning within the user interface despite the backend process completing successfully.
Enforce centralized logging for the entire validation pipeline. Record failed temporal checks and signature mismatches as distinct security events. Log the origin IP alongside the targeted endpoint. This log analysis allows security teams to identify active probing against the infrastructure while maintaining a clean execution path for verified internal routing commands.
Error handling and request retry automation
Network requests fail. Monitor Response status on every dispatch to maintain visibility over the notification pipeline. Analyze HTTP 200 responses carefully. A 200 status confirms the server received the POST request and parsed the syntax. It does not guarantee the visual output matches the intended format if soft warnings exist within the response body. Log the full response object to detect schema deprecation warnings early.
Debug HTTP 400 Bad Request errors immediately upon detection. These status codes indicate fatal client-side malformations blocking the alert generation. Handle invalid_payload exceptions routinely. This specific error fires when the JSON string structure breaks schema requirements. Unescaped quotes inside custom context blocks or exceeding text field character limits trigger this fault. Drop the malformed payload, log the string locally, and alert the system administrator to adjust the payload generator.
Handle invalid_token exceptions by halting the dispatch queue. Revoked permissions, workspace restrictions, or expired OAuth credentials generate this block. Stop dispatching payloads upon receiving this exception. Continual requests with dead credentials trigger automated security blocks against the origin IP.
| Exception Code | Architectural Root Cause | Required Engineering Remediation |
|---|---|---|
| invalid_payload | Malformed JSON syntax or unescaped characters in text blocks | Validate payload against Block Kit schema prior to dispatch |
| invalid_token | Access token revoked, expired, or missing entirely | Pause queue and rotate secrets in the environment variables |
| action_prohibited | Workspace administrator restrictions block bot operations | Audit app scopes and review channel posting permissions |
| channel_not_found | Target destination deleted or archived | Update target routing configuration to an active channel |
Rate limits and queue management
Apply rate limiting controls to prevent API throttling. High-volume events trigger hundreds of notifications simultaneously. Hitting an endpoint limit returns an HTTP 429 Too Many Requests status. Read the Retry-After header included in this specific response. This integer header dictates the exact number of seconds to pause the thread before the server accepts the next payload.
Implement retrying failures using exponential backoff with jitter. Do not hammer the endpoint during a partial outage or severe rate limit event. Multiply the wait time after each consecutive failure. Add a random delay modifier to the interval. This modifier prevents a thundering herd scenario where hundreds of queued URL modification alerts attempt to dispatch simultaneously the millisecond the connection restores.
Redundancy and log indexing
Construct custom code for polling algorithm fallbacks. Network partitions drop webhook payloads entirely. Write failed payloads to a local Redis dead-letter queue. The polling algorithm sweeps this queue every five minutes. It attempts redelivery for a maximum of 24 hours. Purge the payload permanently after this window closes to prevent stale SEO alerts from flooding the channel days after the actual event occurred.
Configure centralized logging for Slack Alerts. Funnel all HTTP transaction logs into a unified monitoring dashboard. Index the HTTP status code, timestamp, and target webhook URL. Tag log entries containing a 4xx or 5xx status as high severity. System administrators require this indexed data to identify routing blackholes causing dropped tier one modification alerts before the missing data impacts operational workflows.
Tracking incident response times and SLA reports
Measure incident response times to quantify operational efficiency. Extract the timestamp value generated during the initial webhook dispatch and calculate the delta against the timestamp of the first registered engineer interaction. This interaction typically manifests as a specific emoji reaction or a threaded reply acknowledging the alert. Log this delta to establish the mean time to acknowledge a critical URL modification. Calculate the mean time to resolution by tracking the interval between the initial alert and the final system state verification event confirming the URL parameters match the expected baseline.
Unchecked architectural flaws in response protocols lead to prolonged SERP volatility. Immediate data capture prevents these bottlenecks.
Track time-series data to identify response degradation over extended periods. Push the calculated delta values into a dedicated time-series database. Tag the metrics with the affected domain, the alert severity level, and the specific shift detected. Querying this structured time-series data reveals patterns in response latency during off-hours or weekends. Engineers utilize these queries to optimize on-call rotations and distribute alert loads effectively across active shifts.
Configuring automated workflows and escalation routes
Configure automated workflows to enforce strict response thresholds. Utilize Workflow Builder for escalation routes when primary channels fail to yield an acknowledgment. Connect a webhook trigger to a workflow designed specifically for high-severity alerts. Set a condition monitoring the alert message for activity.
Implement the following logic structure for escalation workflows:
- Initiate a 15-minute timer upon payload delivery to the primary channel.
- Query the message state at timer expiration to detect acknowledgment markers.
- Halt the workflow if the message contains the designated operational emoji.
- Route the alert to a secondary high-priority channel if the condition remains unmet.
- Trigger a direct ping to the designated on-call engineer via user ID if the secondary channel fails to respond within five minutes.
This automated escalation prevents system failures from lingering in dormant channels. It guarantees that critical errors bypass standard notification fatigue and force immediate visibility at higher operational tiers.
Evaluating SEO team collaboration metrics
Evaluate SEO team collaboration metrics by analyzing channel engagement patterns. Pull interaction logs via the API to audit how engineers handle assigned alerts. Analyze the ratio of acknowledged alerts versus orphaned alerts. High volumes of orphaned alerts indicate a systemic bottleneck in channel architecture or notification fatigue among the primary responders.
Track thread depth and resolution velocity per incident. A high alert volume paired with shallow thread depth and rapid resolution times often points to false positives or non-critical URL shifts triggering high-severity alerts. Recalibrate the audit thresholds discussed in the monitoring logic phase to filter out this noise. Deep threads with prolonged resolution times indicate complex architectural flaws requiring cross-departmental coordination.
Building SLA reports and operational dashboards
Build SLA reports to standardize performance expectations for handling critical modifications. Define acceptable response windows based on the potential impact on indexation and organic traffic. An unauthorized canonical tag modification requires a stricter SLA than a missing meta description due to the immediate risk of deindexation.
Structure the SLA matrix to align alert severity with specific timeframes.
| Alert Severity | Incident Type | Target Acknowledgment | Target Resolution |
|---|---|---|---|
| Critical | Canonical modification, HTTP 5xx errors | 15 minutes | 60 minutes |
| High | Title tag rewrite, structural internal link drop | 30 minutes | 4 hours |
| Medium | Header hierarchy shift, minor status code shifts | 2 hours | 24 hours |
Output resolution metrics to operational dashboards. Connect the time-series database to your preferred visualization platform. Construct panels displaying the real-time SLA compliance rate, rolling average response times, and an aggregate count of escalated incidents. System administrators rely on these operational dashboards during weekly technical reviews to pinpoint workflow inefficiencies. The visual representation of this data isolates persistent routing failures and validates the ROI of the automated alert infrastructure.