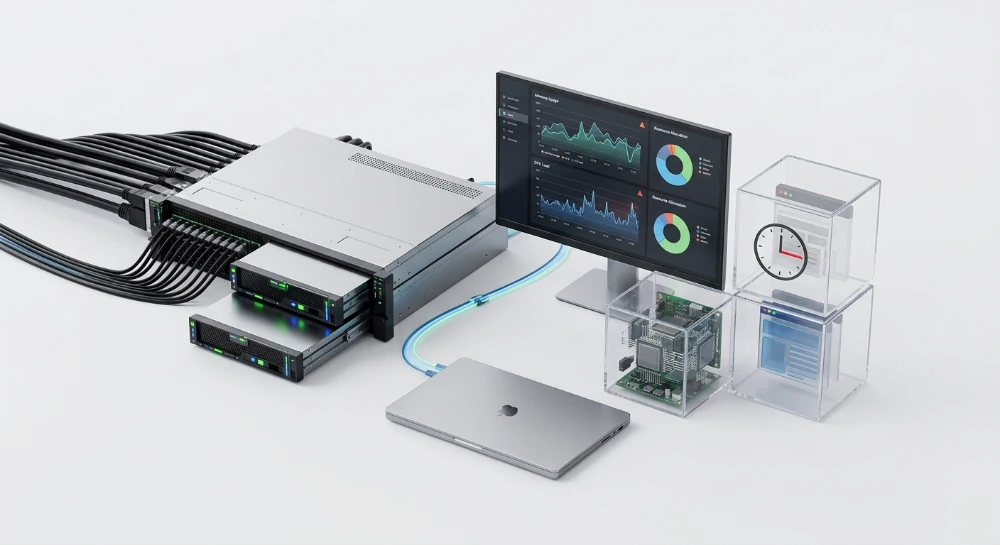
Unhandled Promise rejections and blocked event loops reveal exactly why rendering timeouts of a headless browser affect Node JS environments at scale. When a Puppeteer or Playwright instance exceeds its configured navigation budget, the underlying V8 engine struggles to reclaim allocated memory. Orphan Chromium processes consume remaining heap space. The Node.js single-threaded architecture cannot process incoming HTTP requests while waiting for a frozen WRS instance to serialize the DOM.
Measure memory leaks directly. Engineers invoke process.memoryUsage() to track heapUsed metrics during concurrent SSR workloads. A steady increase in resident set size indicates that headless instances fail to terminate properly after generating an HTML document. V8 Garbage Collection logs track the Mark-Compact phase execution duration. Frequent scavenge cycles cause severe CPU allocation bottlenecks.
Uncollected objects trigger fatal process terminations.
Analyzing the connection between browser timeouts and server infrastructure requires inspecting specific V8 parameters and operating system limits.
- Default heap size configurations restrict Node.js to 1.4 GB on 64-bit systems before throwing an Out Of Memory error.
- Puppeteer timeouts cascade into pending IPC messages that stall the main execution thread.
- WRS anomalies occur when concurrent Chromium tabs exhaust system file descriptors and force continuous CPU context switches.
Architectural foundations of Node.js headless browser integration
Modern JS frameworks output blank HTML shells. Search crawlers expect fully formed markup upon the initial request. This disconnect forces infrastructure teams to implement dynamic rendering or strict Server-side rendering patterns for single-page apps. A dedicated Web Rendering Service bridges this gap by executing client-side code on the server before delivering the final response. WRS deployments rely heavily on Browser Automation libraries to manage these operations. Engineers typically choose between Puppeteer and Playwright to orchestrate complex headless interactions.
Automation tools do not run inside the Node.js process. They act as bridges.
The Node.js event loop manages asynchronous operations while dispatching commands to an isolated browser binary. This distinct separation of concerns relies entirely on IPC communication. Messages travel continuously via the DevTools Protocol. The Node.js application sends a command to navigate to a specific URL. The external browser executes the task independently. The embedded V8 engine parses the remote scripts, fetches API endpoints, and constructs the render tree. Chromium streams status updates back across the IPC channel. Any breakdown in this DevTools Protocol stream leaves the primary Node.js thread hanging indefinitely waiting for a callback that never resolves.
Execution layers in headless rendering
Understanding the internal request lifecycle highlights where timeout vulnerabilities exist across the stack.
| Layer | Component | Architectural Function |
|---|---|---|
| Interception | Express.js Middleware | Routes incoming bot traffic into the automation pipeline. |
| Orchestration | Puppeteer / Playwright | Defines navigation rules and injects the Configurable Timeout Budget. |
| Communication | IPC / DevTools Protocol | Transmits DOM serialization commands and network status events. |
| Execution | Headless Chrome | Downloads remote assets, builds the DOM, and executes JS logic. |
Deploying headless environments on minimal server operating systems introduces hidden architectural traps. Standard application containers lack the native libraries required by the browser binary. Missing Chrome dependencies silently crash the initialization phase. The process spawns but immediately terminates before throwing an error back to the application logic.
System-level requirements dictate headless stability during server provisioning.
- Shared font libraries must be installed to calculate exact text geometry during DOM render passes.
- Core X11 modules handle graphical context generation even without a physical display attached to the server.
- System security libraries manage HTTPS handshake verification during external asset retrieval.
Most SSR architectures deploy custom Express.js Middleware to intercept inbound traffic based on user-agent strings. The middleware pauses the standard HTTP request lifecycle. It hands control over to the background automation script. Prerendering HTML on the fly is a highly volatile operation. Network latency, blocking third-party scripts, and heavy DOM evaluations inflate response times unpredictably. A strict Configurable Timeout Budget prevents rogue pages from holding server connections open permanently. When a target page exceeds this predefined budget, the middleware must instantly sever the pending IPC connection and return a static HTML fallback or a server error status code to protect the underlying infrastructure.
Diagnosing v8 memory limits and OOM killer interventions
Server middleware aborts connections based on timeout configurations, but the data structures generated during those rendering cycles remain in memory. V8 Memory Management handles the subsequent cleanup. Headless browser automation generates massive object graphs representing the rendered DOM. These objects flood the Memory Heap rapidly. If the allocation rate exceeds the garbage clearing rate, the system hits an architectural bottleneck.
Mechanics of generational GC under heavy load
The engine relies on Generational GC to handle object lifecycles. New objects land in the young generation space. The system runs a scavenge operation to clear short-lived data quickly. Short-lived data includes temporary network response buffers and intermediate layout calculations. Surviving objects move to the old generation space.
This is where memory tuning becomes critical.
Long-lived objects trigger the Mark-Compact phase. This is a stop-the-world operation. The engine pauses execution to traverse the object tree, marking active references and compacting the heap. During intense rendering workloads, frequent Mark-Compact sweeps freeze the application flow. The resulting latency cascades into connection drops.
Telemetry and v8 heap statistics
Identifying Memory Leaks requires continuous monitoring of the heap state. Calling
process.memoryUsage
outputs current metrics. The focus must remain on the
heapUsed
value relative to the total allocated heap. Tracking V8 Heap Statistics over time reveals whether the garbage collector is keeping up with the rendering load.
| Metric | Diagnostic Value | Implication |
|---|---|---|
| rss | Resident Set Size | Total memory allocated for the process execution, including native bindings. |
| heapTotal | Engine allocated space | The current maximum size of the Memory Heap limit dynamically adjusted by the engine. |
| heapUsed | Active objects | A high ratio against heapTotal indicates imminent GC sweeps or a persistent leak. |
| external | Native objects bound to scripts | High values often point to unclosed headless browser instances or detached buffers. |
Crash signatures: Heap out of memory and OOM killer
Unchecked memory expansion ends in a system failure. When the runtime exhausts its configured memory limits, it throws a
FatalProcessOutOfMemory
exception. The standard output will display a Heap out of memory error. The script terminates instantly.
A different crash pattern occurs at the operating system level. The host kernel monitors total physical memory. If the server exhausts available RAM, the kernel invokes the OOM Killer. This mechanism abruptly terminates the process consuming the most memory to protect system integrity. Log analysis will show an abrupt exit code without a standard stack trace, masking the root cause of the failure.
Diagnostic flags and GC tuning
Default configurations allocate restricted memory to the heap. Passing the
--max-old-space-size
flag overrides the default limits. Setting this value appropriately gives the garbage collector enough breathing room to operate without constantly triggering the Mark-Compact phase. GC Tuning requires precise adjustments to these limits based on server capacity.
-
--max-old-space-sizeexpands the primary memory pool for stable objects to prevent premature out of memory errors. -
--expose-gcallows manual triggering of garbage collection from the application code for controlled testing and baseline measurement. -
--trace-gcoutputs detailed logs of every garbage collection sweep, including duration, phase type, and reclaimed bytes.
Deep debugging of persistent leaks requires capturing a heap snapshot. A snapshot serializes the entire object graph into a static file. Analyzing this file reveals which application closures, background intervals, or pending network requests are holding references to detached DOM nodes and preventing memory reclamation.
CPU allocation constraints and concurrency bottlenecks
Node.js relies strictly on single-threaded execution to process its event loop. Orchestrating external browser instances introduces severe concurrency bottlenecks. Unpredictable traffic spikes rapidly trigger Request Stampedes. The main thread chokes trying to manage inter-process communication for dozens of active browser contexts simultaneously. CPU allocation immediately becomes the critical limiting factor. The operating system wastes compute cycles on thread switching rather than executing the actual rendering logic. Processing queues stall. Outbound network requests timeout.
Bypassing this architectural flaw demands explicit parallelization. Implementing
worker_threads
isolates the browser orchestration overhead. Moving heavy process management logic off the primary thread keeps the main event loop responsive. Multithreading allows isolated worker pools to handle the headless rendering lifecycle independently while the main application thread routes incoming traffic.
Enforcing boundaries with kernel control groups
Deploying headless rendering architecture inside Docker Containers amplifies CPU starvation risks. Modern orchestration platforms utilize cgroups to enforce strict hardware boundaries on virtualized workloads. These kernel control groups govern the exact volume of CPU cycles a container can consume alongside enforcing strict Memory limits. If the Node.js application hits its CPU quota, the kernel forcefully throttles the process. Execution pauses instantly. Browser instances hang mid-render without triggering explicit application-level error logs.
Kubernetes environments map container Resource limits directly to pod scheduling priorities and eviction policies. Misconfigured resource boundaries lead straight to unpredictable node evictions during cluster load spikes. Kubernetes assigns deployments into specific QoS tiers based entirely on how these requests and limits are defined. Matching the correct tier to your rendering infrastructure dictates long-term system stability.
| QoS Class | Configuration State | Architectural Impact on Rendering Workloads |
|---|---|---|
| Guaranteed | Resource limits exactly match initial requests. | Provides dedicated CPU allocation. Highly protects the pod against unexpected node evictions during cluster-wide traffic surges. |
| Burstable | Requests are defined, but limits are set higher or omitted. | Subject to severe CPU throttling when the underlying host node experiences resource contention from neighboring pods. |
| Best Effort | No CPU or Memory limits defined in the manifest. | First target for termination by the scheduler. Guarantees catastrophic system failure under heavy server load. |
Managing execution queues
Unbounded parallelization crashes the host system. Handling concurrent render requests requires hard mathematical limits on active OS processes. Every open browser tab multiplies the required CPU footprint exponentially. Isolating workloads prevents cascading container failures across the infrastructure.
- Cap the maximum number of active worker threads to directly align with the physical core count of the host machine.
- Reject incoming rendering requests instantly when the active worker queue exceeds defined operational capacity.
- Monitor kernel control group throttling metrics to detect silent CPU starvation before container termination occurs.
- Assign dedicated CPU cores to specific container workloads to completely bypass OS-level thread switching overhead.
Telemetry implementation and log file analysis for timeout detection
Blindly restarting crashed processes masks underlying architectural flaws. Capturing granular telemetry across the execution lifecycle pinpoints the exact millisecond a render request hangs. You need structured data.
Instrumentation with distributed tracing
Relying on basic uptime checks fails when individual rendering requests stall silently. Implement OpenTelemetry to capture distributed Traces across the infrastructure. Attaching unique trace identifiers to every incoming request tracks the exact execution path through the rendering pipeline. An APM platform ingests these spans to visualize Latency bottlenecks before they trigger system-wide crashes.
- Inject trace IDs into the request headers at the network ingress layer.
- Propagate context through the Node.js event loop to tie network requests to specific browser instances.
- Set hard threshold alerts in the APM dashboard for any render cycle exceeding operational baseline metrics.
Native performance profiling
Inject timing logic directly into the render execution flow. The Node.js Performance API provides high-resolution timers to measure precise execution blocks. A PerformanceObserver isolates slow script executions without blocking the main thread.
Wrap the core rendering logic with mark and measure calls. The observer intercepts these events asynchronously, logging the exact duration of the browser automation sequence. This data directly feeds into your Server logs for later parsing.
Exposing metrics via express.js middleware
Client-side debugging requires server-side context. Expose rendering duration metrics directly in the response using the Server-Timing API. Custom Express.js Middleware intercepts the outgoing response to append these specific headers.
| Metric Identifier | Measurement Scope | Diagnostic Value |
|---|---|---|
| ttRenderMs | Total time spent evaluating the page in the headless environment. | Isolates server-side rendering delay from network transit time. |
| TTFB | Duration from the client request to the first byte of the response. | Highlights Express.js routing overhead and initial process blocking. |
| FCP | Time required for the browser to paint the first text or image. | Identifies heavy JS execution blocking the critical rendering path. |
Log file analysis and memory diagnostics
Standard access logs lack the density required for deep troubleshooting. Log File Analysis must correlate application execution states with system hardware utilization. When a timeout occurs, dump the raw JS stacktrace alongside process.memoryUsage metrics. This isolates the specific function causing the thread to hang.
Memory state tracking requires continuous observation.
- Deploy node-memwatch to emit events when baseline heap growth indicates a leak.
- Monitor the heapUsed value during these leak events to identify which specific rendering contexts fail to clear.
- Tail PM2 error logs to map persistent process restart loops against memory exhaustion timestamps.
Parsing these aggregated logs exposes pattern-based failures. A JS stacktrace attached to a timeout exception often points directly to a missing DOM element or an unresolved network promise within the injected evaluation script. Cross-referencing PM2 daemon logs with APM trace data provides the exact operational context required to patch the execution logic.
Configuring browser flags and navigation timers for puppeteer and playwright
Default initialization parameters ship with massive overhead. Launching headless instances without strict constraints guarantees instability under load. Command Line Flags define the sandbox boundaries of the underlying binary. By passing specific Browser Flags during instance creation, server overhead drops drastically. Implementing
args.push('--headless')
is merely the baseline. You must aggressively disable background sync, audio contexts, and GPU compositing to strip away unneeded execution paths.
Mitigating file descriptor exhaustion
High-concurrency environments bleed resources through open network sockets and IPC pipes. Every child process consumes file descriptors. Left unmanaged, the server hits hard OS limits, triggering File Descriptor Exhaustion. System calls fail silently at this threshold. The Node application panics, manifesting as arbitrary timeouts across active page instances. FD Exhaustion requires aggressive flag tuning at the launch stage. Disable unused Chromium features to keep the file descriptor count per process strictly below system limits.
Navigation timers and the networkidle0 trap
Controlling the rendering lifecycle requires abandoning default wait conditions. The
page.goto
method relies on lifecycle events that modern web architectures routinely violate. Relying on
networkidle0
is an architectural flaw. A single lingering tracking pixel or background polling API keeps the network active indefinitely. This pushes the rendering cycle into a fatal Browser Timeout.
Swap ambiguous network heuristics for deterministic DOM states. Inject a strict Configurable Timeout Budget into every navigation call. Map this budget against your server timeout threshold to prevent orphaned processes. Use
page.waitForSelector
to target specific UI elements that signal structural completion. This decouples the success of a render from rogue third-party network requests.
| Navigation Method | Execution Behavior | Timeout Risk Profile |
|---|---|---|
| networkidle0 | Waits until 0 network connections are active for 500ms. | Extreme risk due to endless background JS polling. |
| domcontentloaded | Resolves when the initial HTML document loads and parses. | Low risk, but fails to capture asynchronous client-side rendering frameworks. |
| page.waitForSelector | Halts execution until a specified element appears in the DOM. | Minimal risk. Enforces strict, deterministic rendering constraints based on application logic. |
DevTools protocol and network interception
Executing unoptimized client code on a server destroys hardware capacity. Heavy JS Execution pipelines block the main thread and delay the final layout calculation. Activating network interception via the DevTools Protocol interrupts resource requests before the engine initiates a TCP handshake.
Enable
page.setRequestInterception
to act as an internal firewall for the rendering engine. You dictate exactly what the headless instance is allowed to process. Block heavy media, third-party analytics, and web fonts immediately.
-
Invoke
request.aborton resource types like images, media, and stylesheets that provide no semantic value to the final serialized DOM. -
Use
request.continuestrictly for critical internal API endpoints and main bundle scripts required for application hydration. -
Deploy
Request.respondto mock external data endpoints, serving static local JSON instantly to bypass external network latency.
This granular control layer shrinks the critical rendering path. Routing requests through these interception handlers guarantees the page reaches a complete state within the allocated time window. By stripping away extraneous network calls, the engine avoids unnecessary script parsing, stabilizing the underlying execution thread and eliminating random timeout spikes.
SEO impact: WRS degradation, crawl budget depletion, and indexation failures
Unresolved rendering timeouts sever the communication line between your server architecture and search indexers. Googlebot operates on strict latency constraints. When a headless instance stalls, the WRS fails to deliver the expected payload. Search engine crawlers abandon requests that hang in the execution queue, moving on to other hosts and leaving your dynamic routes unindexed.
Technical SEO requires deterministic server behavior. Unpredictable rendering pipelines break this contract.
Crawl budget and rendering budget limits
Every host receives a finite crawl budget. Prolonged server-side rendering execution directly consumes this allocation. Instead of discovering new URLs, crawlers spend their quota waiting for unresponsive headless scripts to return data. The secondary rendering budget faces even stricter execution limits. If the HTML layer takes too long to serialize, the WRS abandons the rendering job entirely.
JavaScript SEO depends on the timely delivery of a fully populated DOM. Blank pages resulting from timed-out renders destroy organic visibility.
- Monitor average response times in server access logs to identify crawler bottlenecks.
- Isolate slow internal API calls that delay the final headless layout calculation.
- Validate the structural integrity of the output payload using crawler simulation environments.
Indexation failures and status code anomalies
Timeouts manifest in search indices through contradictory server signals. Rendering Anomalies trick crawlers into processing incomplete documents, corrupting the index.
A frequent architectural flaw involves returning a 200 HTTP status code while serving an empty body. The headless rendering script crashes under load, but the Express routing middleware successfully catches the initial request and returns a success header. Googlebot processes the empty DOM and categorizes the route under Soft 404 errors. The content gets systematically deindexed. Conversely, failed internal router hydration during a timeout spike can trigger a hard 404 status code for legitimate, high-traffic pages.
| Failure Type | Crawler Symptom | Architectural Cause |
|---|---|---|
| Soft 404 errors | Deindexed URLs despite 200 HTTP response | Headless browser crash before DOM population. |
| Partial Indexation | Missing text blocks in SERP snippets | WRS captures layout before asynchronous data resolves. |
| Timeout Drops | Crawl rate plummets in Google Search Console | Thread lock delays response beyond crawler wait thresholds. |
Diagnostics and performance degradation
Engineers must audit the raw output directly from the perspective of the crawler. The URL Inspection Tool provides a live snapshot of the Serialized HTML generated by your server infrastructure. Compare this output against the expected local DOM state. Discrepancies highlight exactly where the rendering pipeline choked.
Deploy the Rich Results Test to validate structured data extraction. If the schema objects rely on client-side hydration that times out during server rendering, the rich snippets vanish from the SERP immediately.
WRS degradation heavily skews field performance metrics. Slow server-side execution delays the initial document response. This lag pushes back every subsequent browser loading phase, destroying Time to Interactive and degrading overall Core Web Vitals. The server must serialize and transmit the HTML before any client-side metrics can even begin recording. Optimizing the headless execution window guarantees search engine visibility and stabilizes crawler throughput.
Infrastructure auto-scaling and crash recovery architectures
Rendering pipelines demand aggressive horizontal scaling. A monolithic architecture crumbles when search engines launch sudden crawl spikes. Migrating to Microservices isolates the browser processes from core application logic. This isolation prevents a rendering crash from taking down the primary API. Dedicated rendering fleets require specific orchestration to survive sustained load.
Crash recovery and container orchestration
Headless browsers inevitably leak memory over time. Processes bloat. Automated Crash Recovery must exist at the lowest possible level. Implementing PM2 with the
--max-memory-restart
flag provides a brutal but effective fail-safe. If a worker exceeds its memory threshold, PM2 kills and respawns it before the operating system intervenes.
Containerized workloads face stricter hardware boundaries. Within a
Dockerfile
, memory tuning requires exact alignment with container limits. Relying on default memory allocation leads directly to kernel-level termination. Linux kernel cgroups enforce these hardware boundaries. When a container exceeds its cgroups memory limit, orchestration platforms react aggressively. Kubernetes node evictions trigger immediately, killing the pod and dropping all active rendering connections. Set your Kubernetes resource requests equal to limits. This guarantees the pod has dedicated RAM and prevents sudden eviction during high-traffic crawl events.
Serverless environments and traffic throttling
Managing custom clusters introduces severe operational overhead. Offloading this workload to Serverless environments shifts the architectural burden. Solutions like Browserless manage the underlying instances and expose an endpoint for script execution. You send the instructions; they manage the hardware. This transitions the engineering challenge from server maintenance to concurrent connection management.
Search engines do not respect your backend capacity by default. Without strict ingress rules, a request stampede exhausts all available browser contexts. Aggressive Rate Limiting is mandatory. When the rendering queue reaches capacity, trigger immediate Throttling.
- Return a strict 429 Response to the crawler immediately.
-
Include a
Retry-Afterheader specifying the exact delay in seconds. - Log the rejected request to monitor capacity deficits in real time.
This implementation forces the crawler into an Exponential Backoff pattern. The bot slows its crawl rate automatically. Server stability is preserved while maintaining the URL in the active crawl queue.
Dynamic scaling and cache layers
Scaling policies dictate system survivability during traffic spikes. CPU utilization is a misleading metric for browser automation. Track concurrent active connections instead. AWS ECS Target Tracking adjusts task counts dynamically based on these custom metrics. Step Scaling rules dictate exact container increments when the queue depth breaches defined thresholds. Validate these Auto-scaling triggers continuously within your CI/CD Pipeline using simulated load testing.
Re-rendering identical pages wastes compute resources. Bypassing the browser entirely is the most efficient scaling strategy. Deploy a robust RENDER_CACHE layer. Store the fully generated HTML payload in a high-speed memory store. Configure aggressive Caching headers to serve this payload directly to the crawler.
| Cache Strategy | Implementation Layer | Impact on Server Load |
|---|---|---|
| RENDER_CACHE Data Store | Application Middleware | Reduces headless execution by serving pre-serialized HTML directly from RAM. |
| Edge Caching | Network Ingress | Nullifies backend requests for static assets and unchanged HTML payloads. |
| Stale-While-Revalidate | Caching headers | Serves cached HTML instantly while triggering asynchronous background rendering tasks. |
Invalidate the RENDER_CACHE only when content updates fire via CMS webhooks. This architecture protects the infrastructure from redundant processing. Auto-scaling events only occur for genuinely new or expired URLs, keeping resource consumption efficient and lowering operational costs.