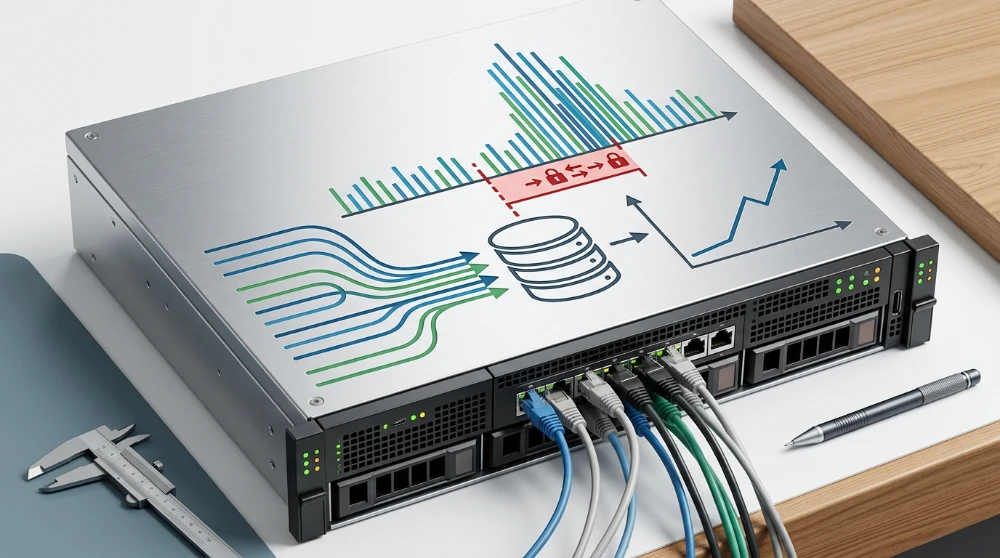
Understanding why response time of HTTP suffers degradation under heavy bot crawling requires mapping the exact correlation between high-concurrency automated network requests and origin server resource exhaustion. Search engine crawlers and automated scraping scripts routinely execute thousands of simultaneous GET requests per minute. A sudden influx of hits from Googlebot or AhrefsBot rapidly depletes available PHP workers. This creates a severe processing bottleneck at the application layer. Positions in the top-3 of Google organic search results capture over 50 percent of all clicks for a query, making high-performance rendering an absolute SEO necessity.
When concurrent connections exceed the configured MaxRequestWorkers directive in Apache or worker_connections in NGINX, subsequent incoming requests enter a network wait queue. System memory saturation occurs rapidly as each active connection holds RAM allocation hostage during processing. CPU cycles spike aggressively while the server attempts to parse dynamic CMS templates and execute nested MySQL queries. Server response metrics escalate from an optimal 200 milliseconds to over 2000 milliseconds. This TCP latency forces both real users and search engine indexing bots to drop the connection.
Troubleshooting origin load saturation requires direct access.log file parsing. Extracting server logs using grep commands isolates the specific User-Agent strings triggering the infrastructure strain.
Engineers cross-reference these raw logs with the Host status dashboard in the Google Crawl Stats Report. This interface exposes exact average response time metrics specifically for HTML parsing and JavaScript execution. Pinpointing the precise timeframe where Googlebot begins logging 503 Service Unavailable errors establishes the strict concurrency limits of the deployment.
Architectural bottlenecks: How High-Concurrency crawling induces response time degradation
Unregulated automated traffic overloads origin servers through a strict resource exhaustion sequence. Concurrent connections rapidly consume available worker threads within the web server layer. Incoming HTTP requests enter a rigid network wait queue once these thread pools deplete. This backlog forces immediate RAM allocation holds per connection. System memory saturation follows instantly. High swap usage crashes application performance while CPU wait times escalate as processors attempt to handle simultaneous background tasks.
PHP code execution delays multiply under this specific infrastructure strain. Dynamic CMS platforms require extensive backend processing to render individual URLs. Hundreds of PHP workers simultaneously attempt to execute complex queries against the database during a heavy crawl event. This initiates severe query contention.
Database locking under concurrent load
Relational databases collapse under the pressure of concurrent read/write requests generated by uncontrolled indexing behavior. The processing queue halts completely when storage engines cannot resolve query conflicts.
- MySQL table-level locks block subsequent read queries during massive update sequences triggered by background cache invalidations.
- PostgreSQL deadlocks occur when simultaneous scraping processes demand identical memory blocks for complex JOIN operations.
- MariaDB thread concurrency limits force incoming database calls into a sleeping state until active row-level locks release.
Origin load scales linearly with request volume until the server hardware hits its hard capacity ceiling. Latency vectors shift dramatically at this precise threshold. TTFB degrades first. The time required to process the backend logic and return the initial payload skyrockets from optimal milliseconds to full seconds.
Mapping the resource exhaustion sequence
| Exhaustion Phase | Affected Subsystem | Primary Symptom | Impact on TTFB |
|---|---|---|---|
| HTTP Request Queuing | Network Layer | Worker thread depletion | Moderate latency increase |
| Memory Saturation | RAM | High swap I/O overhead | Severe processing delay |
| Application Bottleneck | PHP FPM | Script execution timeout | Extreme degradation |
| Database Contention | MySQL / PostgreSQL / MariaDB | Row and table locks | Complete query failure |
Sustained heavy crawling eventually severs active TCP sessions. Server connectivity failures emerge when the reverse proxy layer forcibly terminates unresponsive origin connections due to strict timeout limits. High TTFB signals an unstable environment to search engine indexers. The architectural flaw lies in forcing the origin server to parse dynamic code and compile database results for every single automated request.
Engineers must track latency vectors across the entire request lifecycle. Spikes in CPU utilization directly mirror the exact volume of concurrent DB queries running in the background. Unoptimized server configurations transform routine indexing into an unintentional denial of service event at the application layer.
Run a deep technical crawl to identify 4xx errors, missing meta tags, and indexation blockers.
Isolating bot activity via log file analysis and Google crawl stats report
Raw server logs provide the only unfiltered record of inbound automated traffic. Relying solely on client-side analytics masks the true volume of server-side executions triggered by scrapers and indexing engines. You must extract and filter access.log files to quantify exact resource consumption per UA string.
Parsing these logs requires strict regex patterns to isolate specific request components. Standard Nginx and Apache combined log formats require pattern matching against the IP address, timestamp, HTTP method, status code, and UA substring.
^(\S+) \S+ \S+ \[([^\]]+)\] "([A-Z]+ [^ "]+ HTTP\/[0-9.]+)" ([0-9]{3}) ([0-9]+|-) "[^"]+" "([^"]+)"This pattern extracts the trailing UA string into a discrete capture group. You must categorize these strings using substring matching rather than exact string equivalence. User-Agent strings undergo frequent versioning updates. Hardcoding full strings guarantees missed detection during traffic analysis.
- Search Indexers: Match substrings containing Googlebot, bingbot, YandexBot
- Social Graph Scrapers: Filter for facebookexternalhit, LinkedInBot, Twitterbot
- Uptime Monitoring: Isolate Pingdom, StatusCake, Datadog
- Generic HTTP Libraries: Flag python-requests, Go-http-client, curl
Cross-Referencing host status and crawl requests
Log data means little without correlation to search engine behavior. Navigate to Settings then Crawl Stats within GSC. The host status dashboard reveals exactly how Google evaluates server availability during automated request bursts.
Extract the total crawl requests metric and compare it against the access.log volume for the matching time window. Discrepancies indicate rogue bots spoofing legitimate UA strings. You must verify reverse DNS lookups for IPs claiming search engine origin. High crawl requests coupled with degraded average response times in GSC confirm that origin saturation is actively harming indexing efficiency.
Evaluate the average response time graph over a 90-day period. Look for direct overlap between spikes in data downloaded per day and spikes in latency.
Visualizing sawtooth wave patterns
Plotting hourly log volume often reveals a Sawtooth wave pattern. This visualization displays a sharp, nearly vertical spike in concurrent requests followed by a jagged, gradual decline. It perfectly models automated batch processing behavior.
Legitimate human traffic follows smooth diurnal curves. Sawtooth patterns indicate rigid cron jobs or aggressive scraping scripts dumping massive thread pools onto the server simultaneously. The origin attempts to process these requests concurrently, instantly depleting worker processes at the peak of the wave.
| Metric Source | Data Point | Diagnostic Value |
|---|---|---|
| access.log | Concurrent IPs per second | Identifies distributed botnet crawling behavior |
| GSC Crawl Stats | Average response time | Signals search engine crawl rate throttling thresholds |
| GSC Crawl Stats | Data downloaded per day | Quantifies raw bandwidth consumed by HTML payload extraction |
| access.log | UA substring frequency | Highlights dominant scraper software and parsing anomalies |
Calculate the total data downloaded per day across all identified bot traffic. Compare the GSC reported payload sizes against the byte count logged by the web server. Substantial deviations point to dynamic CMS loops generating infinite URL variations for search crawlers to process.
Heavy data extraction phases drain network bandwidth rapidly. Identifying the exact timestamp of these extraction bursts allows engineers to map the Sawtooth spikes directly to CPU queue backups.
Infrastructure drain from Next-Generation AI crawlers and RAG scrapers
Legacy log analysis frameworks fail to account for the distinct operational parameters of LLM data crawlers. Standard search engine crawlers maintain predictable fetch cycles optimized for long-term indexation. Agentic traffic operates on completely different architectural imperatives. Next-generation retrieval mechanisms prioritize real-time context aggregation over polite server interactions.
The distinction between indexation crawling and agentic traffic defines the severity of the server load. Standard bots parse HTML payloads sequentially and respect historical crawl delay configurations. Agentic traffic, driven by RAG systems, executes high-concurrency fetch operations to satisfy immediate user prompts. When an interface requires real-time data grounding, the underlying scraper floods the target server with parallel requests. This bypasses typical traffic distribution curves entirely.
Resource consumption audit of LLM data crawlers
Identifying the exact origin of the load requires isolating specific signature strings responsible for the most aggressive scraping patterns. These agents frequently disregard standard structural boundaries within a CMS.
| User-Agent Entity | Operational Characteristics | Infrastructure Impact |
|---|---|---|
| GPTBot | Broad-spectrum baseline data extraction | High-volume sequential fetching that exhausts server thread pools rapidly |
| ClaudeBot | Deep-linking retrieval and parsing | Elevated CPU load due to sustained extraction across complex URL hierarchies |
| OAI-SearchBot | Real-time grounding for user queries | Unpredictable traffic bursts triggering instant dynamic page generation |
| PerplexityBot | High-velocity RAG payload extraction | Forces immediate origin response, often bypassing standard static delivery |
| Bytespider | Aggressive parallel scraping | Massive concurrency spikes leading to rapid database connection depletion |
Dynamic page generation amplifies the resource drain caused by these agents. RAG scrapers actively parse faceted navigation links, internal search query parameters, and raw API endpoints. Every unique URL string generated by a dynamic CMS forces the origin server to execute fresh database queries. The system cannot rely on pre-generated HTML assets.
The infrastructure cost compounds significantly when processing JavaScript-heavy pages. Retrieval agents equipped with headless browser capabilities must execute the client-side code to access the required data payloads. This execution process forces the origin server to handle dozens of simultaneous asynchronous requests for a single initial fetch operation.
- Origin processors must parse complex routing logic designed for client-side rendering.
- Agentic scrapers trigger heavy API payload generation rather than simple static delivery.
- Concurrent rendering processes consume excessive memory allocation per worker thread.
- Uncached JSON responses bypass static delivery layers and hit the core database directly.
Heavy dependency on client-side rendering turns standard scraping into a multi-tiered load event. An individual PerplexityBot or OAI-SearchBot request for a JavaScript-heavy page translates into a cascade of secondary network requests. The server processes the initial document fetch, followed immediately by rapid-fire API calls as the agent renders the application state. System failure occurs when the volume of these multi-stage extraction processes exceeds the available worker capacity.
Data downloaded per day metrics inflate exponentially under this agentic load. Unlike traditional crawlers that update stored representations, retrieval agents continuously hit the origin server to confirm data freshness. This constant validation loop creates permanent architectural bottlenecks in environments heavily reliant on dynamic rendering.
Bulk Google and Yandex index checker
Verify agency reports and track live SERP status in Google and Yandex to protect your SEO ROI.
Origin server optimization: Caching topologies and resource offloading
Unoptimized origin servers collapse under heavy automated extraction. Every cache MISS triggers a complete backend execution cycle, forcing the database and application layer to regenerate identical HTML documents for different crawling agents. Maximizing the cache HIT ratio forms the primary defense against infrastructure drain. A rigid server-side caching architecture intercepts these requests before they reach the execution runtime.
Bypassing the application logic requires layered caching topologies.
PHP environments OPcache and LiteSpeed_Cache deployment
Raw PHP execution carries immense overhead. OPcache intercepts this process by storing precompiled script bytecode in shared memory, eliminating the need to load and parse scripts on every request. This keeps memory usage low even when dynamic requests bypass the static delivery layer. High-concurrency environments demand aggressive OPcache memory allocation to prevent cache churn during massive crawling events.
Bytecode caching alone cannot resolve database bottlenecks. LiteSpeed_Cache operates at the server level, delivering complete HTML pages directly from memory or disk. This bypasses the CMS entirely. Deploying these distinct caching mechanisms offloads discrete segments of the server architecture.
| Caching Layer | Execution Phase | Resource Offloaded | Primary Benefit During Bot Crawling |
|---|---|---|---|
| OPcache | PHP Compilation | Processing overhead | Accelerates runtime execution for uncacheable dynamic requests. |
| LiteSpeed_Cache | Page Generation | Database Operations | Delivers complete HTML without invoking the CMS runtime. |
Preloading assets via Cache_Warmer scripts
A cold cache presents a massive vulnerability during bot storms. If a massive crawl event hits expired cache entries, the origin server experiences a thundering herd problem as multiple bots trigger concurrent page regeneration. Deploying cache_warmer scripts neutralizes this threat.
A properly configured cache_warmer script acts as an internal crawler targeting specific execution parameters.
- Execute cache_warmer scripts via cron during off-peak hours to rebuild expired entries.
- Target high-priority URL clusters based on access.log hit frequencies.
- Configure the script to pass specific HTTP headers to bypass edge caching and directly hit the origin cache layer.
- Set cache expiration times strategically to prevent massive simultaneous invalidation.
Dynamic content environments must rely on these automated warming cycles. Relying on organic traffic or external bots to prime the cache guarantees origin load spikes.
Global delivery edge computing and CDN topologies
Relying entirely on the origin server for static asset delivery guarantees bandwidth saturation. A global CDN architecture intercepts crawler traffic at edge locations before it crosses the core network. Edge computing pushes the caching layer out to geographically distributed POPs.
AnyCast routing directs crawler requests to the nearest available POP based on network topology. This reduces physical latency and insulates the origin server from massive data downloaded per day volumes. When multiple bots request the same resources from different global regions, the edge nodes serve the cached payloads locally. Origin server request reduction is achieved because only the initial fetch hits the main infrastructure.
Aggressive edge caching policies must enforce strict expiration settings for static assets. Offloading image, CSS, and JS delivery to the CDN frees up origin worker threads to handle the complex API payloads required by agentic scrapers. Bandwidth usage drops significantly, preventing upstream provider throttling.
Edge security configuration: WAF policies and adaptive rate limiting
Unmitigated scraper traffic bypassing cache layers will crush application servers. Next-Gen WAF deployments act as the critical frontline defense. They parse incoming requests at the network perimeter before HTTP connections reach upstream infrastructure.
Relying solely on User-Agent blocking is architecturally flawed. Advanced retrieval agents rotate headers and spoof legitimate browsers. Robust mitigation requires deep packet inspection and heuristic behavioral analysis across multiple request parameters.
Next-Gen WAF ruleset configuration
Deploying enterprise-grade platforms like Cloudflare WAF, AWS WAF, or Fastly WAF shifts the processing burden away from the origin. These systems evaluate request patterns against global threat feeds. Akamai Bot Manager and Datadome Bot Protection take this further by utilizing machine learning models to detect headless browsers and scraping frameworks in real time.
You must map specific WAF rulesets to URI structures. API endpoints require strict payload validation. HTML document requests need behavioral scoring.
| WAF Provider | Bot Mitigation Feature | Target Scraper Vector | Recommended Action |
|---|---|---|---|
| Cloudflare | Bot_Fight_Mode | Known automated tools and script libraries | Managed Challenge |
| Cloudflare | Super_Bot_Fight_Mode | Definitive bots spoofing residential IP ranges | Block |
| AWS WAF | AWSManagedRulesBotControlRuleSet | Distributed scraping networks | Challenge / Rate Limit |
| Datadome | In-memory behavioral analysis | Headless browser instances | Hard Block |
IP intelligence and device fingerprinting
Static IP blacklisting scales poorly. Scraping operations cycle through massive proxy pools. Deploy IP intelligence filtering that scores ASN reputation and connection types. Datacenter IP addresses and known proxy nodes must face immediate scrutiny.
Device fingerprinting provides a more resilient layer. Next-Gen WAF platforms inject asynchronous javascript challenges to gather client telemetry. They analyze canvas rendering, hardware concurrency, and supported ciphers. If a scraper fails to execute the challenge or presents conflicting hardware signatures, the request drops.
Establish strict Whitelist/blacklist parameters to maintain essential crawler access while restricting scrapers.
- Whitelist validated search engine subnets verifying reverse DNS lookups.
- Blacklist ASNs associated with cheap cloud hosting providers commonly used for scraping architectures.
- Enforce geography-based blocking if the target application serves a strictly local demographic.
- Bypass mitigation rules for verified monitoring endpoints and internal deployment pipelines.
Implementing throttling thresholds
Aggressive agents ignore crawl delay directives. Enforcing Throttling thresholds at the edge prevents origin resource starvation. Adaptive rate limiting evaluates request frequency per session rather than globally.
Configure distinct rate limiting rules based on content types. Static assets can sustain high request volumes. Database-heavy queries cannot. Set a baseline threshold of 30 requests per minute per IP for document paths. Trigger an Adaptive challenge-response mechanism upon violation.
This setup degrades gracefully. Legitimate users browsing unusually fast encounter a transparent computational challenge. Aggressive scrapers hit a hard block wall. Infrastructure budget is preserved.
Adaptive Challenge-Response workflows
Blocking immediately upon threshold breach causes false positives for NAT environments. Deploy multi-tiered challenge sequences.
- Issue a silent computational challenge requiring processor cycles to solve.
- Escalate to a visible interactive challenge if the silent check fails or the request rate continues accelerating.
- Drop the connection entirely if the interactive challenge times out or is bypassed anomalously.
This tiered defense ensures maximum availability for human traffic while neutralizing high-concurrency bot swarms at the edge layer.
Detect stealthy removals, nofollow tag injections, and altered anchors instantly.
TCP/IP and kernel tuning for High-Concurrency network requests
Edge defenses deflect hostile scraping. Legitimate high-frequency crawling still hits the OS stack. Default Linux networking parameters assume moderate client concurrency. They collapse during severe inbound socket pressure. A sudden influx of retrieval agents exhausts file descriptors and fills TCP backlog queues instantly.
Network layer optimizations prevent socket exhaustion. Modifying kernel parameters allows the origin to process concurrent TCP connections without queuing delays.
Kernel parameter adjustments for socket management
High network request volumes exhaust the SYN backlog before the application layer registers the traffic. Unprocessed connections stall.
Update the sysctl configuration to expand connection handling limits. Apply the following parameter modifications.
- net.ipv4.tcp_max_syn_backlog: Increase to 65536 to hold more incomplete connections during bursts.
- net.core.somaxconn: Raise to 65535 to elevate the maximum queue length of completely established sockets waiting to be accepted.
- net.ipv4.tcp_tw_reuse: Enable to allow immediate reallocation of TIME_WAIT sockets for new outgoing connections.
- net.ipv4.tcp_fin_timeout: Decrease to 15 to rapidly purge orphaned connections from the memory pool.
- fs.file-max: Scale to 2097152 to prevent socket allocation failures.
Reload the kernel configuration. The OS now absorbs connection spikes rather than dropping packets.
Implementing TCP BBR congestion control
Legacy congestion algorithms rely on packet loss to dictate transmission speeds. This architecture creates bufferbloat. Latency spikes occur as packets queue in intermediate network buffers.
TCP BBR evaluates bottleneck bandwidth and round-trip propagation time to govern data flow. It models the network path continuously. Pacing data dynamically prevents buffer saturation entirely.
Switching to TCP BBR directly impacts network performance. It reduces latency and ping times natively across global routing paths. Throughput scales efficiently even on high-latency links. Enable TCP BBR and the fq qdisc in the kernel settings to activate this congestion control mechanism.
Optimizing SSL session handshake overhead
Cryptographic negotiation consumes disproportionate processing cycles during initial connections. High-frequency crawlers opening unique TLS sessions per request saturate CPU capacity.
Optimize SSL session handshake overhead by eliminating redundant asymmetric key exchanges. Enable TLS session resumption. This allows returning clients to resume previous sessions using symmetric encryption keys.
| Configuration Target | Implementation Directive | Performance Impact |
|---|---|---|
| ssl_session_cache | Set to shared:SSL:50m | Stores active sessions across worker processes in memory. |
| ssl_session_timeout | Increase to 1d | Maintains session validity for 24 hours to reduce renegotiation. |
| ssl_session_tickets | Enable | Offloads session state storage to the client side. |
| TLS 0-RTT | Enable early data | Eliminates round trips for resumed connections. |
Zero-RTT configuration requires strict replay attack mitigation. Only enable early data for idempotent HTTP methods.
DNS resolution metrics and network diagnostics
Slow internal DNS queries stall outbound API calls and localized routing. Monitor DNS resolution metrics continually. High resolution latency degrades application throughput even when compute resources remain optimal. Deploy a local caching resolver to eliminate upstream DNS query latency.
Network incidents require rapid isolation. Standard traffic analysis fails to pinpoint microscopic routing fluctuations.
Run traceroute aggressively during traffic anomalies. Map packet paths across upstream providers to identify specific routing loops or asymmetric latency hops. Extract the diagnostic telemetry.
Process this high-dimensional routing data through UMAP plots. UMAP maps complex network latency vectors and packet drop metrics into 2D visual clusters. Anomalous traffic patterns separate from baseline routing geometry. This technique isolates transit provider failures from localized congestion instantly. Traffic engineering decisions shift from reactive guesswork to deterministic routing adjustments.
Correlating 5XX errors and response code degradation with crawl budget deficits
Server overload directly throttles organic indexing capability. When concurrency exceeds origin capacity, infrastructure returns 5XX status codes instead of HTML payloads. Search engine algorithms interpret these failures as an explicit signal to reduce request frequency.
This dynamic creates a negative feedback loop. Crawl capacity drops precisely when content freshness requires rapid indexing.
Mapping response code failures to server overload events
Crawl breakdown reports isolate specific failure vectors during high-stress periods. Analyzing these reports reveals exact architectural bottlenecks.
503 Errors typically indicate resource queue exhaustion. While system administrators deploy 503s for planned maintenance, unhandled bot concurrency triggers them organically. Load balancers drop queued connections when origin servers fail to clear active PHP threads. Search engine bots encounter these walls and immediately scale back their crawl rate to prevent further infrastructure damage.
Other 5XX variations expose different points of failure.
- 500 Internal Server Error points to database query timeouts or fatal application crashes under load.
- 502 Bad Gateway indicates upstream process death, often PHP or Node.js workers terminating prematurely.
- 504 Gateway Timeout signifies network layer delays between the reverse proxy and the application tier.
Heavy saturation also triggers anomalous 404 errors. When database connections fail during peak loads, CMS routing logic often defaults to a 404 instead of throwing a proper 500 error. This destroys indexing stability. Crawlers deindex valid URLs because the server lied about their existence during a temporary resource crunch.
| HTTP Response Code | Overload Trigger | Crawler Action |
|---|---|---|
| 503 Service Unavailable | Application worker queue full | Drastic reduction in crawl frequency |
| 502 Bad Gateway | Upstream application crash | URL skipped, retry scheduled with penalty |
| 504 Gateway Timeout | Database lock or slow query execution | Crawl budget burned without payload delivery |
| 404 Not Found | CMS routing failure during DB disconnect | Immediate deindexing of the affected URL |
Redirect loops and robots.txt unavailability
Crawl budget allocation operates on strict mathematical limits. Every HTTP request consumes a specific unit of this budget. Misconfigured server responses drain this allocation rapidly.
Redirect loops destroy crawl efficiency. A configuration error causing a 5-hop 301 redirect chain consumes five units of crawl budget to reach a single destination URL. Under heavy concurrency, the latency added by each hop often triggers a timeout before the final payload resolves. The budget vanishes. No content gets indexed.
The robots.txt file dictates all downstream crawler behavior.
If high server load causes a 5XX error on the robots.txt request, search engines halt crawling entirely. Algorithms assume strict directives might exist within the file. To avoid violating potentially restricted access, they drop all active connections. Returning a 404 on robots.txt permits full site crawling, but returning a 503 or 500 blocks every subsequent request until the file resolves cleanly. Keep this file cached at the network edge.
Degraded host status and analytics distortion
Host status metrics reflect the aggregate health of your infrastructure from the crawler's perspective. Degraded status indicates a high volume of dropped connections, TCP resets, or DNS timeouts.
Correlate degraded host status directly with resource_usage saturation. Plot CPU utilization spikes against the precise timestamps of elevated 5XX errors in your log files. When memory swapping occurs, response latency spikes exponentially, turning previously successful 200 OK responses into 504 timeouts.
This saturation distorts traffic analytics.
Legitimate users attempt to load pages during bot-induced resource crunches. The resulting latency causes severe TTFB degradation. Users abandon the session before the analytics tracking scripts fire in the browser. Server logs show high request volumes, but client-side analytics report a massive drop in traffic. Conversion KPI dashboards collapse.
Traffic quality metrics become unreliable. The bot traffic generates a flood of 5XX and 404 errors in the logs, while genuine user behavior is masked by the infrastructure failure. Identifying the exact resource threshold where 200 OK responses transition into 5XX errors establishes your absolute concurrency limit.