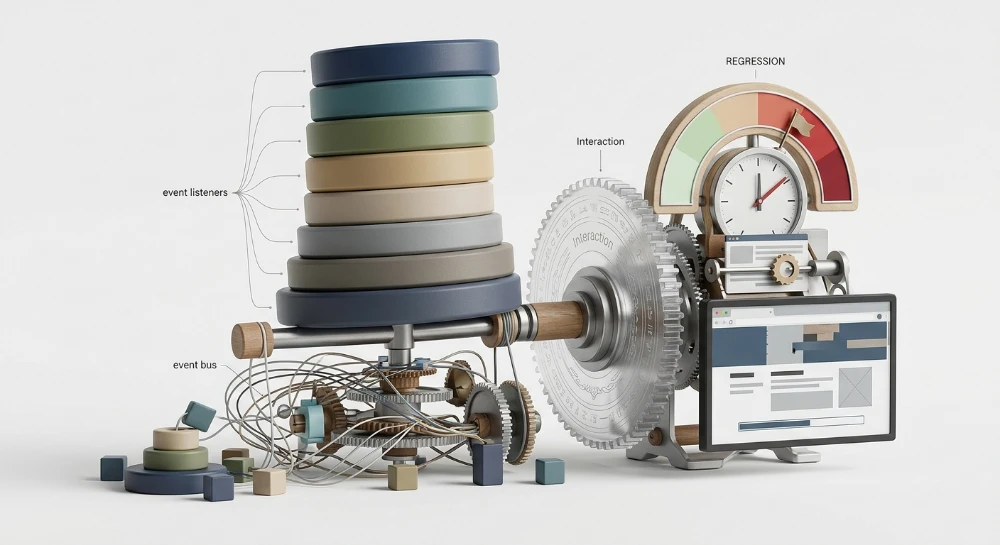
Understanding how heavy stacking of listener events impacts Next Paint Interaction regressions requires strict analysis of the browser main thread during user input. INP measures responsiveness across the page lifecycle by recording the latency of all clicks, taps, and keyboard interactions. The metric breaks down into three exact architectural phases. These components are Input Delay, Processing Time, and Presentation Delay. When a user triggers a pointerdown event, the browser must clear the current task queue before it can fire the assigned callbacks.
Excessive DOM event binding forces the CPU to process overlapping logic sequentially.
Heavy listener stacking creates immediate Core Web Vitals regressions by inflating JavaScript execution time. An element carrying multiple click listeners for tag firing, visual state changes, and form validation executes all attached scripts in one contiguous block. This single block extends into a Long Task. Lengthy execution spikes TBT metrics and blocks the main thread from running style recalculations. Current processing duration thresholds at the 75th percentile via CrUX mandate an INP score under 200 milliseconds for a passing grade. Exceeding 500 milliseconds guarantees poor interaction responsiveness and stalled visual feedback.
Validating these latency regressions requires direct observation of performance thresholds in RUM data. Front-end architectures enforce specific timing constraints to avoid dropping frames:
- Input Delay must stay below 50 milliseconds to prevent initial event queue bottlenecks.
- Processing Time for synchronous callback execution should not exceed 50 milliseconds per interaction.
- Presentation Delay requires painting the next layout state within 16 milliseconds to align with standard display refresh intervals.
Architectural mechanics of interaction to next paint and Main-Thread congestion
The deprecation of FID mandates a shift in front-end performance telemetry. FID measured only the initial queuing delay of a user's first interaction. It ignored how long the browser took to execute the assigned code and render the resulting visual changes. INP enforces a strict evaluation of the entire rendering pipeline across the full page lifecycle, capturing every discrete interaction.
Every logged interaction parses into three distinct sub-part times.
| INP Sub-Part | Architectural Mechanism | Main-Thread Impact |
|---|---|---|
| Input Delay | The interval between the hardware interrupt and the browser initiating the event handler. | Inflates heavily when the Task Queue is saturated with background scripts or layout thrashing code. |
| Processing Time | The synchronous execution duration of all callbacks tied to the triggered event. | Dictates CPU time consumption; creates execution bottlenecks if functions do not yield to the renderer. |
| Presentation Delay | The time required to calculate layout geometries, composite layers, and paint the next frame. | Stalls entirely until the Call Stack empties and pending microtasks resolve. |
Discrete interactions enter the event loop through a strict hardware-to-software relay.
When a user initiates a
pointerdown
,
keydown
, or
click
event, the input is not processed instantaneously. The operating system forwards the interaction to the browser's main process, which routes it directly to the renderer process. The renderer drops this event payload into the Task Queue. The browser must wait for the currently executing script to finish before picking up this new interaction payload. This waiting period defines the initial Input Delay phase.
Synchronous callback execution and frame blocking
Once the event loop shifts focus to the newly queued interaction, Processing Time begins. This phase exposes the critical architectural flaw in heavy DOM event binding.
Concurrent callback functions attached to a single element do not execute in parallel. They run synchronously. If a
click
event carries independent listeners for data layer pushes, form validation logic, and visual state toggles, the JavaScript engine fires them back-to-back in the exact order they were registered. The CPU cannot interrupt this chain to prioritize other tasks. This sequential execution forces the main thread to process massive continuous logic blocks, inflating JavaScript execution time and extending CPU time drastically.
These stacked functions merge into a Long Task.
The browser operates on a single-threaded rendering architecture. It cannot recalculate DOM layouts or rasterize pixels while the JavaScript engine processes callback logic. Browser Painting remains completely blocked. Presentation Delay stretches well beyond the required display refresh interval. The visual interface freezes until the entire synchronous event chain concludes, the Call Stack reaches an empty state, and the rendering engine finally regains control of the main thread.
Profiling interaction regressions using chrome DevTools and LoAF API
Lab environments mask field latency. Isolating heavy event callbacks requires a deterministic diagnostic workflow inside the Chrome DevTools Performance panel. Relying on network throttling alone yields false negatives. CPU throttling must be configured to 4x or 6x slowdown to accurately mirror the processing constraints of mobile devices rendering bloated DOM structures.
Initiate a trace recording. Execute the problematic interaction. Stop the recording.
The resulting timeline exposes the exact sequence of execution. Focus immediately on the Interactions track. This horizontal swimlane displays visual blocks representing individual user inputs. Hovering over an interaction block reveals the precise duration breakdown across the input, processing, and presentation phases. Blocks flagged with red crosshatching indicate a latency threshold violation.
Flame chart and call stack navigation
Expand the Main thread track directly below the Interactions lane. The Flame chart visualizes the execution stack in a top-down hierarchy. Tasks exceeding 50ms display a red triangle in their upper right corner.
- Click the flagged interaction task to populate the Summary tab at the bottom of the interface.
- Switch to the Bottom-Up or Call Tree view to sort functions by self-time.
- Locate specific event handlers binding to the target DOM node.
- Identify independent script executions overlapping with first-party handler logic.
The Call stack renders the exact chronological firing order. If a single click triggers five distinct data layer pushes and a UI state change, the Flame chart will show these functions stacked sequentially. Pinpoint the specific script dominating the processing phase. Click the file link in the Summary tab to jump directly to the offending line of code in the Sources panel.
Script attribution with event timing and LoAF API
DevTools provides localized diagnostics. Field telemetry requires structural implementation. The Event Timing API surfaces interaction metrics directly to the browser window. It captures the latency of discrete inputs but lacks granular script attribution. Standard task boundaries often obscure the root cause of frame delays.
The LoAF API bridges this diagnostic gap.
Standard animation frame profiling relies on short execution windows. The LoAF API isolates rendering cycles that exceed 50ms. It provides deep script attribution by exposing the specific JS execution blocks responsible for delayed paint cycles. Integrating the LoAF API allows engineers to extract the exact function names and script URLs blocking the main thread during field usage.
Compare the diagnostic capabilities of standard metrics versus the LoAF API.
| Diagnostic Capability | Standard Task API | LoAF API |
|---|---|---|
| Duration Threshold | Measures tasks over 50ms | Measures frame updates over 50ms |
| Script Attribution | Top-level execution only | Granular function-level mapping |
| Presentation Delay Insight | Invisible | Explicitly tracked and attributed |
| Field Applicability | High noise ratio | Precise RUM integration |
Configuring PerformanceObserver for RUM telemetry
Extracting 75th-percentile field data demands automated aggregation. The web-vitals JS library provides a standardized interface for capturing interaction latencies. Wrap this library within a custom PerformanceObserver configuration to catch interaction events before they unregister.
Deploy the following architectural pattern to push interaction metrics to an analytics endpoint.
import {onINP} from 'web-vitals';

onINP((metric) => {
  const body = JSON.stringify({
    name: metric.name,
    value: metric.value,
    rating: metric.rating,
    interactionTarget: metric.entries[0]?.target,
    loadState: metric.navigationType
  });

  navigator.sendBeacon('/analytics/endpoint', body);
});
This implementation captures the exact target node triggering the delay. Send this payload to a data warehouse. Query the dataset filtering strictly for the 75th-percentile values. Search engine assessment operates exclusively on this specific percentile slice across a rolling 28-day window. Evaluating median or 90th-percentile data leads to misaligned optimization priorities. Focus engineering resources solely on the interaction pathways failing the 75th-percentile threshold in RUM reports.
Isolating Third-Party script payloads and tag manager bloat
External scripts operate outside direct engineering control but consume the exact same main-thread resources as core application architecture. When a marketing pixel or tracking script parses, it compiles and executes synchronously. This blocks rendering. DOM operations initiated by external payloads force the browser into heavy recalculation cycles. Injecting iframe elements or appending tracking nodes manipulates the document structure mid-flight. User interactions occurring during this specific window sit pending in the task queue. The main thread remains totally congested until the third-party execution context clears.
The execution toll of synchronous chat widgets
Chat widgets introduce severe execution bottlenecks. These third-party applications ship massive JavaScript bundles to handle WebSocket connections, state management, and UI rendering. Loading them synchronously spikes CPU time immediately upon initialization. The browser halts processing user inputs to compile the widget payload.
Delaying initialization does not solve the underlying architectural flaw if the script evaluates during a user interaction. Triggering a massive chat payload mid-scroll or exactly when a user clicks a core navigation element causes catastrophic latency. The interaction handler fires, but the browser cannot present the visual update until the chat widget finishes parsing.
| Widget Integration Method | Main-Thread Impact | Next Frame Render Block |
|---|---|---|
| Synchronous execution on document ready | Continuous CPU starvation during load | Critical rendering block |
| Interaction-triggered eager load | Spikes processing duration during event | High latency on specific DOM node |
| Idle-state lazy initialization | Defers execution to unused CPU cycles | Minimal interference |
Auditing containers for redundant tracking scripts
Tag managers function as delivery vehicles for unvetted code. Bloated containers accumulate redundant analytics events, legacy marketing pixels, and duplicate tracking scripts over multiple deployment cycles. Marketing teams frequently deploy overlapping configurations targeting the exact same DOM nodes. This multiplies the processing burden on a single user interaction.
Auditing the workspace requires stripping away legacy configurations and mapping active triggers strictly to current application elements. Execute the following teardown sequence for container optimization.
- Export the container configuration as a JSON file to programmatically parse active trigger dependencies.
- Identify and purge zombie tags tied to DOM selectors that no longer exist in the codebase.
- Consolidate duplicate analytics events firing simultaneously on identical interaction targets.
- Migrate non-critical pixels from initialization triggers to custom delayed execution events.
- Restrict wildcard DOM ready listeners that evaluate on every page regardless of necessity.
Benchmarking latency deltas via network blocking
Proving the precise rendering block caused by external scripts demands controlled testing. Chrome DevTools provides a native mechanism to strip these variables from the execution timeline without altering source code. This isolates the exact latency contribution of the third-party script.
Navigate to the Network request blocking tab. Add wildcard patterns for suspected domains. Block the request.
*google-analytics.com*
*hotjar.com*
*intercom.io*
Reload the interface. Record a new interaction profile focusing on the previously failing DOM elements. Measure the Next Frame Render latency. Compare this metric against the baseline profile captured before blocking the domains. The delta reveals the exact main-thread congestion introduced by the third-party payload. Use this raw data to justify moving specific marketing scripts off the critical rendering path or migrating them to server-side tracking endpoints.
Implementing Yield-to-Main patterns for event callbacks
When an interaction handler traps the main thread with heavy computational logic, the browser cannot paint visual updates. This directly inflates processing duration regressions. Breaking heavy computation within interaction handlers forces the script to pause, process the pending visual state, and resume work later. Task chunking prevents monolithic execution blocks from locking the interface.
Yielding returns control to the browser between discrete logic steps.
Task chunking APIs and code implementations
JS provides multiple mechanisms to defer code execution. Selecting the correct API determines whether a background calculation disrupts user interaction.
- The legacy setTimeout approach pushes deferred tasks to the back of the queue.
- Modern scheduler.yield() pauses execution but keeps the resumed task at the front of the queue.
- The scheduler.postTask API assigns specific priority levels to asynchronous operations.
- Using requestIdleCallback delays execution until the browser determines the main thread is completely free.
To implement yielding effectively, wrap your loop iteration in an asynchronous function. Check for API support and fall back to the macro-task queue if necessary.
async function processDataChunks(dataArray) {
  for (let i = 0; i < dataArray.length; i++) {
    processItem(dataArray[i]);
    if (i % 50 === 0) {
      await yieldToMain();
    }
  }
}

function yieldToMain() {
  if ('scheduler' in window && 'yield' in scheduler) {
    return scheduler.yield();
  }
  return new Promise(resolve => setTimeout(resolve, 0));
}
This implementation guarantees the browser can execute UI updates every 50 iterations.
Contrasting yield mechanisms
The efficacy of each API depends entirely on the execution priority required by the specific feature.
| API Method | Queue Placement | Priority Control | Primary Architecture Use Case |
|---|---|---|---|
| scheduler.yield() | Front of queue (continuation) | Inherits current priority | Breaking up massive UI-blocking calculations. |
| scheduler.postTask() | Variable based on priority | Strict (background, visible, blocking) | Scheduling distinct background tasks. |
| setTimeout() | End of macro-task queue | None | Legacy fallback for yield patterns. |
| requestIdleCallback() | Idle queue | Low (can specify timeout) | Analytics beaconing and telemetry processing. |
Throttling and debouncing High-Frequency inputs
Certain interactions inherently spam the task queue. A keypress during search autocompletion or wheel event listeners during complex data visualization scrolling will execute callbacks faster than the CPU can process them. You must regulate these execution rates.
Debouncing resets an execution timer every time the interaction fires. The callback only executes once the user stops interacting for the predefined duration. Use this for search input fields.
function debounce(callback, delay) {
  let timer;
  return function(...args) {
    clearTimeout(timer);
    timer = setTimeout(() => callback.apply(this, args), delay);
  };
}
Throttling enforces a strict execution rhythm. Regardless of how many times the event fires, the callback executes exactly once per specified time window. This logic is mandatory for wheel event listeners where continuous visual feedback is required without locking the thread.
function throttle(callback, limit) {
  let waiting = false;
  return function(...args) {
    if (!waiting) {
      callback.apply(this, args);
      waiting = true;
      setTimeout(() => waiting = false, limit);
    }
  };
}
Apply these wrappers directly during the event listener binding phase. This intercepts the DOM trigger spam before it enters the processing logic.
Optimizing event delegation and passive listener architecture
Binding event handlers directly to massive node collections scales poorly. Attaching a discrete click listener to thousands of dynamically generated product cards forces the JS engine to allocate separate memory structures for each binding. The browser must continuously track these nodes. This architectural flaw bloats memory usage and slows down initialization.
Event delegation solves this via event bubbling. You attach a single listener to a persistent parent container. When a user interacts with a deeply nested child node, the event bubbles up the DOM tree to the parent. You intercept the payload there.
document.querySelector('.product-grid-container').addEventListener('click', (event) => {
  const card = event.target.closest('.card-item');
  if (!card) return;
  processCardInteraction(card.dataset.id);
});
SPA frameworks frequently mount and unmount components. Localized event listeners tied directly to these volatile child nodes create severe memory leaks. When the framework destroys the node without an explicit removeEventListener call, the garbage collector cannot reclaim the memory. The detached DOM node remains trapped in memory because the active listener retains a reference.
Document-level delegation structurally prevents this retention. The listener resides on an upper-level persistent container. Child nodes can cycle in and out of the DOM without stranding memory. The reference graph remains stable.
Bypassing Main-Thread synchronization for scrolling
Touch event listeners and wheel event listeners introduce a specific rendering block. By default, the browser engine pauses scroll compositing when these events fire. It waits for the main thread to execute the callback to see if the script invokes event.preventDefault().
This synchronization creates mandatory input latency. The user drags their finger or scrolls the mouse wheel, but the UI remains frozen until the JS execution finishes. Visual feedback is delayed.
The passive flag breaks this dependency. It acts as a contractual promise to the browser engine that the callback will not cancel the scroll behavior.
document.addEventListener('touchstart', handleTouchStart, { passive: true });
document.addEventListener('wheel', handleScrollAnalytics, { passive: true });
Passive dispatch offloads the scroll action entirely to the compositor thread. The browser paints the scroll frame instantly. The JS callback executes asynchronously. Input latency drops to zero before the visual feedback triggers.
Compare event listener configurations to determine architectural requirements for standard interactions.
| Event Type | Recommended Binding Level | Passive Flag Requirement |
|---|---|---|
| click / keydown | Document or container delegation | Not applicable |
| touchstart / touchmove | Localized or delegated | Mandatory |
| wheel / mousewheel | Window or document | Mandatory |
| scroll | Window | Mandatory |
Audit your current event listener architecture against these technical baselines.
- Scan the codebase for any touchstart or wheel listeners lacking the configuration object.
- Migrate all repeated list-item listeners to a single parent container using event.target.closest().
- Eliminate event.preventDefault() calls inside scroll-blocking handlers.
- Verify memory heap snapshots in Chrome DevTools to confirm detached DOM nodes are clearing post-interaction.
Mitigating layout thrashing and synchronous Re-Render cascades
The browser rendering engine operates on a strict sequence. It processes JavaScript, calculates style, builds the layout tree, and executes the paint operation. Modifying a DOM node within an event callback invalidates the current layout state. Requesting a geometric property immediately afterward creates a critical rendering block. The browser halts script execution. It computes the entire layout synchronously to return the requested value.
This cycle is a Forced Synchronous Layout. Executing this pattern repeatedly within a single interaction handler triggers layout thrashing.
Event handlers attached to user interactions frequently require element dimensions to update the UI. Fetching these dimensions at the wrong time destroys frame budgets.
Certain properties and methods force the browser to flush the layout queue immediately. Querying any of the following triggers style recalculation and reflow.
- Element metrics: offsetTop, offsetLeft, offsetWidth, offsetHeight
- Scroll states: scrollTop, scrollLeft, scrollWidth, scrollHeight
- Client dimensions: clientTop, clientLeft, clientWidth, clientHeight
- Computed styles: getComputedStyle()
- Coordinate mapping: getBoundingClientRect()
Interleaving these reads with DOM mutations forces the engine to recalculate layout multiple times per task.
Batching DOM reads and writes
Architectural isolation of read and write operations prevents synchronous reflows. Read all necessary layout properties first. Store them in memory. Execute DOM mutations sequentially afterward.
Standardizing this workflow requires a batching mechanism. Developers implement read/write queues using the requestAnimationFrame API to synchronize operations with the browser rendering cycle.
// Anti-pattern: Interleaved reads and writes
elements.forEach(element => {
  const width = element.offsetWidth; // Read forces layout
  element.style.width = width + 10 + 'px'; // Write invalidates layout
});
// Optimal pattern: Batched reads and writes
const widths = [];
// Phase 1: Read
elements.forEach(element => {
widths.push(element.offsetWidth);
});
// Phase 2: Write
requestAnimationFrame(() => {
elements.forEach((element, index) => {
element.style.width = widths[index] + 10 + 'px';
});
});Isolating mutations inside a requestAnimationFrame callback ensures the browser applies all style changes in a single operation immediately preceding the Next Frame Render.
Compare the execution footprint of interleaved versus batched DOM operations to understand the performance delta.
| Execution Pattern | Layout Recalculations | Main-Thread Blocking | Presentation Delay Risk |
|---|---|---|---|
| Interleaved Read/Write | Multiple per loop iteration | High | Severe |
| Batched Synchronous | Single recalculation | Moderate | Moderate |
| requestAnimationFrame Batching | Zero synchronous layouts | Low | Minimal |
Excessive node count and presentation delay
DOM depth directly dictates the computational cost of style recalculations. A bloated DOM amplifies Presentation Delay.
Interaction callbacks often toggle CSS classes on parent containers to trigger state changes. The browser must traverse the subtree to evaluate rule matching for all descendant nodes. Complex CSS selectors paired with a massive DOM tree require significant CPU cycles to parse.
The Next Frame Render remains blocked until this style recalculation completes.
Target absolute minimum node counts. The HTML structure should not exceed 1,500 total nodes. Maximum depth must remain under 32 levels. A parent node should contain fewer than 60 child elements.
When an event listener triggers a re-render cascade across 3,000 nodes, the processing overhead eclipses the frame budget.
Audit style invalidations in the DevTools Performance panel. Select a Recalculate Style event. Inspect the Elements Affected property in the Summary tab. If a single click event forces the browser to evaluate thousands of nodes, you must flatten the DOM architecture and isolate state changes to localized child components.