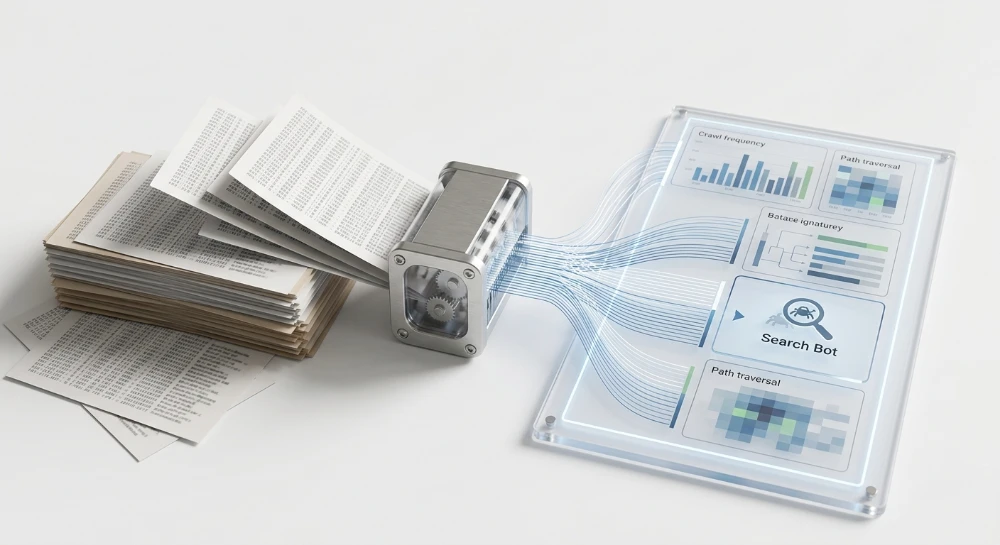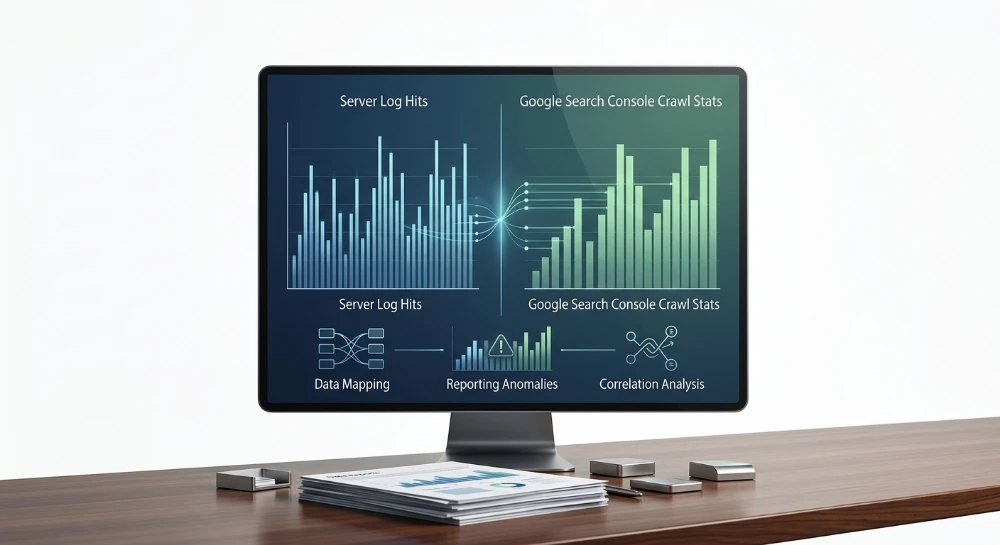
Analyzing how crawl stats in Google Search Console help correlating hits of a server log reveals exact search engine behavior patterns that dictate indexation velocity. Cross-referencing these two specific datasets isolates the exact numerical variance between expected rendering queue requests and actual origin server throughput. A standard Apache or Nginx access file captures every single request, but matching these raw data entries against the Google Search Console API outputs exposes infrastructure anomalies like hidden infinite redirect loops or unauthorized crawler spoofing.
BigQuery handles this unification process for enterprise data arrays. Exact data alignment prevents 503 Service Unavailable bottlenecks.
Measuring crawl capacity limits requires mapping 429 Too Many Requests status codes against the specific 90-day timeframes provided in the host status reports. Payload bloat across JavaScript files directly inflates Time to First Byte metrics. Unifying these massive data architectures allows technical SEO teams to isolate exact discrepancies between origin server responses and search engine rendering timelines. Position changes tied to the Core Web Vitals algorithm depend entirely on this raw log extraction.
Validating raw access records against search engine reporting interfaces requires specific structural alignment.
- Extracting normalized Pacific Time timestamps from the API for exact cross-referencing with Coordinated Universal Time server timeframes.
- Mapping 500-level server errors detected in raw logs against the Unknown Failed Requests metric in the reports.
- Identifying orphan URL structures present in origin files but entirely absent from the active indexing pipeline.
- Measuring exact byte transfer limits using the Total download size metric to adjust rendering budgets.
Architectural fundamentals of search engine crawling and log generation
Raw access data requires rigid structural protocols to ensure accurate parsing across different server environments. Search engine crawlers generate massive request volumes that must be captured utilizing standardized log formatting standards. The Combined Log Format serves as the traditional baseline for Apache and Nginx environments. It appends referrer and user-agent strings to the standard Common Log Format. Microsoft IIS environments natively generate the W3C Extended Format. This protocol allows system administrators to append or remove specific tracking fields based on customized server configurations. JSON-structured logs represent the modern standard for enterprise architectures. Outputting server hits as nested JSON objects eliminates complex parsing logic during data extraction.
Every logged hit relies on core dimensions to isolate bot activity from human traffic. Missing data across these variables destroys attribution accuracy during log file analysis.
-
$remote_addrcaptures the originating IP address initiating the connection. -
$time_localrecords the exact server timestamp when the hit occurred. -
$requestcontains the HTTP method, the requested URL path, and the protocol version. -
$statusoutputs the server response code delivered back to the crawler. -
$body_bytes_sentmeasures the exact payload weight transmitted over the network. -
$http_user_agentidentifies the client software string declared during the request.
Origin server logs vs CDN access logs
Modern routing architectures split log generation into two isolated data streams. Origin server logs originate directly from Apache, Nginx, or IIS infrastructures. These raw files only record hits that bypass external caching layers and force the main server to process the request. They represent the absolute backend reality of your hardware load.
CDN access logs capture traffic at the network perimeter. Platforms utilizing Cloudflare Logs, AWS CloudFront, or the Akamai Log Delivery Service intercept requests geographically closer to the client. This introduces a critical visibility gap for technical SEO. If a cached HTML document satisfies a crawler request at the edge, the origin server registers zero activity. Auditing only origin logs while running an aggressive caching layer results in severely underreported crawl statistics.
Deploying a unified log architecture requires mapping the differences between these two environments.
| Architectural Layer | Log Source | Data Capture Scope | Primary SEO Function |
|---|---|---|---|
| Origin Infrastructure | Apache, Nginx, IIS | Uncached hits, dynamic renders, API calls | Isolating server errors and backend bottlenecks |
| Edge Network | Cloudflare Logs, AWS CloudFront | Cached assets, edge redirects, firewall blocks | Tracking true crawl volume and total bot hits |
| Log Delivery | Akamai Log Delivery Service | Aggregated global edge request data | Analyzing geographic crawler distribution |
Edge computing impact on request capture
Deploying edge computing infrastructure fundamentally alters HTTP GET request capture mechanics. Search engine bots no longer connect directly to the primary data center. Distributed nodes intercept the crawler connection. The edge node evaluates the requested URL against active cache rules.
A cache hit triggers an immediate 200 response from the edge server. The CDN logs this transaction. The origin server remains entirely blind to the event. A cache miss forces the edge node to request the document from the origin. Both the CDN and the origin server log this specific transaction. Synchronizing these fragmented data streams dictates the accuracy of your capacity analysis. Relying on incomplete request captures leads to catastrophic miscalculations regarding how search engines traverse your architecture.
Run a deep technical crawl to identify 4xx errors, missing meta tags, and indexation blockers.
Configuring and exporting Google search console crawl stats data
Proper data extraction requires strict verification protocols. Owner or Full User permissions dictate access to GSC reporting layers. Property configuration dictates the data scope. Domain properties aggregate all protocol and subdomain variations into a single consolidated dataset. URL-prefix properties isolate traffic to specific structural segments. Engineering teams must validate which property type aligns with the logging architecture. Mismatched property scopes corrupt baseline metrics before analysis even begins.
Core extraction methods
Extracting raw data from the interface limits analysis due to restrictive timeframes and row limits. Technical SEO relies on three scalable pipelines for data extraction:
- Search Console bulk exports facilitate localized spot checks on specific URL paths through direct manual downloads.
- GSC API endpoints allow programmatic access to bypass interface limitations. Engineers query the API to extract detailed time-series data authenticated via service accounts.
- Google Analytics BigQuery exports push the raw GSC dataset directly into a cloud warehouse daily. This eliminates API quota restrictions and preserves historical data indefinitely for massive enterprise architectures.
Essential metrics
The raw export contains four non-negotiable metrics required for baseline configuration:
- Total crawl requests indicate the absolute volume of crawler activity hitting the designated property over a specific timeframe.
- Total download size measures the cumulative byte payload transferred during crawler interactions.
- Average response time flags server latency and processing delays at the page level.
- Host status acts as the binary check for critical infrastructure failures regarding DNS resolution, server connectivity, and robots.txt fetching.
Mapping data dimensions
Aggregated totals provide zero diagnostic value on their own. Slicing the data across predefined GSC dimensions isolates specific architectural bottlenecks:
| Dimension Category | GSC Data Dimensions | Diagnostic Utility |
|---|---|---|
| Crawled file type breakdown | HTML, Javascript, CSS, JSON | Identifying rendering payload weight and API crawling intensity |
| Crawl purpose | Discovery crawls, Refresh crawls | Differentiating new URL indexing efforts versus existing asset maintenance |
| Googlebot type | Smartphone, Desktop, Image bot, Video bot | Isolating user-agent specific fetch behaviors and mobile-first indexing parity |
The intersection of these variables reveals exact crawler priorities. High total download size coupled with heavy Javascript file type crawls indicates rendering inefficiencies. High refresh crawls on low-priority URLs signify a misaligned crawl hierarchy. Exporting these specific dimensions builds the relational matrix required to map external crawler behavior against internal server performance.
Parsing, normalizing, and verifying server log files
Raw access logs contain severe data contamination. Relying on unverified server output guarantees flawed diagnostics. Malicious actors, scrapers, and automated auditing scripts routinely execute HTTP requests while identifying themselves as legitimate search engine crawlers. This user-agent spoofing inflates perceived bot activity and skews baseline performance metrics.
You must verify the identity of every bot request before allowing the data into your analysis pipeline. Network-level validation definitively filters fake crawlers from the dataset.
Validating crawler identities
Server configurations log the user-agent string exactly as presented by the requesting client. Any script can declare itself Googlebot in the HTTP header. Exclusion of user-agent spoofing requires strict cryptographic or DNS-based verification routines.
The standard verification methodology utilizes a two-step DNS process:
- Reverse DNS lookup: Query the IP address recorded in the log file to determine its associated hostname. A legitimate Googlebot request will return a hostname ending in googlebot.com or google.com.
- Forward DNS lookup: Execute a query on the retrieved hostname to resolve it back to an IP address. The resulting IP must perfectly match the original IP address that executed the HTTP request.
High-volume server environments rely on IP verification against ground truth datasets to reduce DNS query latency. Search engines publish their active crawler IP ranges via dynamically updated JSON files. Network engineers match incoming request IP addresses against these verified CIDR blocks. Any request claiming a search engine user-agent that originates from an IP outside the published ground truth dataset gets immediately dropped from the SEO analysis pipeline.
Regex operations for data extraction
Unprocessed log entries exist as continuous, unstructured text strings. Normalizing this data requires precise pattern matching to isolate specific dimensions. Regular expressions separate the raw string into distinct, queryable database columns.
Standard parsing operations using regex target three primary extraction points:
- Timestamp extraction: Isolates the exact date and time of the server hit. All extracted times must be normalized to a uniform timezone to prevent temporal misalignment when cross-referencing external data sources.
- URL path isolation: Strips the root domain and protocol, capturing only the specific URI requested. This standardizes the format for downstream matching.
- Query length calculation: Extracts and measures the character count following the question mark delimiter in the URL path. Unusually long query strings flag architectural parameter bloat.
A standard regex implementation extracts the timestamp by targeting the characters bracketed within the log entry. Another operation captures the exact byte size of the server response. This converts a static text file into a structured matrix.
Handling massive datasets and infrastructure
Managing standard .log file formats is viable only for small-scale applications. Enterprise architectures generate terabytes of server hit data daily. Downloading and processing monolithic .log files locally causes immediate system crashes.
Cloud infrastructure requires scalable log aggregation. AWS environments pipe server hits directly into CloudWatch. Google Cloud Platform routes origin server requests through Stackdriver. These cloud logging architectures stream raw hit data into centralized storage buckets, bypassing the physical limitations of static .log files. Extracting this data requires specialized parsing software designed for high-velocity ingest.
Tooling specifications for log file analysis
Processing normalized log data requires software capable of handling millions of rows without memory degradation. The choice of analysis tool dictates the volume of data you can successfully parse.
The following table outlines the architectural differences among industry-standard log file analysis software:
| Analysis Platform | Processing Architecture | Optimal Dataset Application | Ingestion Method |
|---|---|---|---|
| Screaming Frog Log File Analyser | Local Desktop | Small to medium datasets constrained by local machine RAM | Manual static .log file upload |
| Oncrawl Log Analyzer | Cloud SaaS | Enterprise environments requiring unified dashboard integration | Cloud buckets, FTP, API streams |
| JetOctopus | Cloud SaaS | Massive scale datasets requiring instant rendering speeds | Direct log streaming, Cloud integration |
Local desktop tools force rigid hardware limitations on the dataset. Cloud-based analyzers ingest server data continuously, allowing for real-time monitoring of bot behavior across distributed server clusters.
Bulk Google and Yandex index checker
Verify agency reports and track live SERP status in Google and Yandex to protect your SEO ROI.
Data blending methodologies: Mapping server logs to GSC metrics
Storing parsed logs and API exports in isolated silos limits analytical capacity. BigQuery functions as the centralized blending layer. Establish a partitioned and clustered database architecture to handle the ingest volume. Partitioning the database by date and clustering by URL Path drastically reduces query execution time. This schema setup prevents memory saturation when processing heavy SQL queries across millions of rows.
Connecting these disparate datasets demands strict alignment. You must construct a composite primary key. A single matching dimension causes severe data duplication errors during the merge. Anchor the dataset combination sequence on three distinct mapping variables:
- URL Path: Strip protocol and domain parameters to execute matches on relative paths.
- HTTP Method: Filter the integration to evaluate GET requests explicitly.
- Normalized Pacific Time timestamps: GSC logs daily activity strictly in Pacific Time. Server architectures frequently record event times in UTC. Convert server log time dimensions to Pacific Time prior to table insertion to prevent day-to-day alignment failures.
The data blending sequence
Execute the integration using a FULL OUTER JOIN in BigQuery. This specific logic blends the tables while preserving unmatched rows from both original data sources. The critical analytical step aligns the Server response status directly against the GSC reported HTTP Status Codes.
SELECT
  COALESCE(logs.url_path, gsc.url_path) AS merged_url,
  logs.server_status,
  gsc.gsc_status,
  logs.bot_hits,
  gsc.crawl_requests
FROM server_logs logs
FULL OUTER JOIN gsc_data gsc
  ON logs.url_path = gsc.url_path
  AND logs.http_method = gsc.http_method
  AND logs.pt_date = gsc.pt_date
A direct status match validates infrastructure stability. Status code disparities isolate specific points of friction. Mismatched outputs between a 200 OK server log and a 5xx API error indicate mid-layer routing drops or reverse proxy failures occurring before the data reaches the origin server.
Looker studio visualization architecture
Raw SQL outputs require visual translation. Connect BigQuery directly to Looker Studio to render the blended datasets. Configure the visual elements to highlight metric divergence automatically.
| Dashboard Component | Configuration Settings | Metric Output |
|---|---|---|
| Time-Series Line Graphs | Multi-Y axes application | Total bot hits versus Search Console Total crawl requests |
| Dataframes | Paginated table format | URL-level status code mapping and hit volume ratios |
| Scatter Plots | Logarithmic scale application | Server response status frequency distribution |
Line graphs utilizing Multi-Y axes reveal broader trend anomalies. Total bot hits dictate actual server load. Search Console Total crawl requests define indexing capacity recognition. Plotting Total bot hits on the left Y-axis and Total crawl requests on the right Y-axis exposes synchronization gaps. When the left and right axes diverge significantly, undetected technical bottlenecks exist in the network layer. Deploy Dataframes for granular URL investigations. This tabular format enables rapid filtering by HTTP Method and URL Path to pinpoint the exact failure nodes driving the divergence.
Identifying reporting anomalies and crawl deficiencies
Data divergence indicates infrastructure leaks. When GSC groups undefined network timeouts into the vague Unknown Failed Requests bucket, technical SEO diagnostics require exact mapping to origin server logs. Cross-reference this GSC metric against raw server-side log datasets in BigQuery. You will typically find direct correlations with backend 5xx Server Errors or upstream DNS resolution failures. These failures happen before the HTTP response header fully generates. The crawler terminates the connection, logs an unknown failure, and abandons the URL.
Analyze hit volume distributions across unique URL paths. Disproportionate crawler activity on non-canonical or dynamically generated routes highlights systemic architectural flaws. Left unchecked, these flaws consume crawl capacity and degrade indexing efficiency.
| Architectural Flaw | Server Log Pattern | Technical Impact |
|---|---|---|
| Spider Traps | Infinite directory repetition within the URI string | Traps bots in endless recursive paths, wasting crawl limits |
| Redirect Chain Loops | High frequency of 301 or 302 statuses on cyclical path sequences | Forces crawler connection drops before destination URL discovery |
| Parameter Bloat | Exponential unique URL hits differing only by query string values | Dilutes indexing consolidation and floods logs with duplicate content processing |
Status code reporting often fractures between the origin server and the indexing engine. Evaluate specific disparities to diagnose rendering and access blocks. A standard failure point involves Soft 404s. The server access log records a clean 200 OK status code, indicating successful file delivery. GSC flags the same URL as a Soft 404 because the rendering engine evaluates the DOM and detects missing or insufficient core content. The origin server sees a success, but the search engine sees a failure.
Another severe misalignment occurs with access controls. Compare 401 and 403 server blocks against HTTP header directives. Relying on 401 or 403 status codes to manage crawler flow triggers immediate connection rejection. The log captures the block instantly.
Conversely, if engineering deploys an X-Robots-Tag with a noindex directive at the application layer, the server log still registers a 200 OK. The crawler must download the entire payload to read the header directive before deciding not to index the page. Misunderstanding this distinction leads to inaccurate server capacity planning.
Isolating orphan pages via log analysis
Deploy comparative analysis to locate Orphan pages. These are URLs present in the server logs receiving active bot hits but completely absent from GSC indexing data and internal site architecture.
- Extract all unique URL paths from the blended BigQuery dataset.
- Filter the dataset strictly for rows where log-derived bot hits are greater than zero.
- Cross-reference this output against active GSC Index Coverage exports.
- Isolate URLs missing from the GSC dataset entirely.
This query logic isolates legacy URLs, rogue XML sitemaps, or external backlinks driving crawl traffic to disconnected site architecture. Identifying these shadow URLs allows for precise redirect mapping or definitive removal, reclaiming lost server processing overhead.
SEO structure and reciprocal link analyzer
Detect orphan pages, deep click depths, and toxic reciprocal links built by careless agencies.
Optimizing crawl budget and server capacity limits
Server resources directly dictate crawl volume. Spikes in Latency trigger algorithmic safety throttles that slash subsequent request rates. High TTFB forces connection timeouts. Average response time defines the mathematical ceiling for daily URL fetch rates. Bytes Transferred indicates raw bandwidth consumption per connection. Optimize these operational metrics to scale throughput without allocating additional hardware instances.
Extended response times act as a structural bottleneck. Crawlers operate on fixed time allocations per domain. Every millisecond wasted waiting for server processing reduces the total number of HTML documents retrieved.
Minimizing payload bloat
Payload bloat exhausts bandwidth allocations rapidly. Massive CSS files and synchronous JS rendering blocks force crawlers to allocate excessive processing overhead just to parse the DOM. Strip these non-critical rendering paths.
Execute a targeted payload reduction protocol.
- Identify asset files exceeding standard kilobyte thresholds in server logs.
- Block non-essential JS rendering blocks via robots directives if they do not manipulate core textual content.
- Minify and compress necessary CSS files using Brotli or Gzip algorithms at the CDN edge.
- Configure aggressive caching headers for static assets to offload origin server requests.
Every byte shaved from the payload directly increases the total URLs processed per crawl session.
Managing crawl frequency
Efficient crawl frequency management requires definitive HTTP signaling. Wasting server cycles on unchanged documents drains capacity.
Deploy HTTP 304 Not Modified headers. This directive requires robust ETag or If-Modified-Since configuration at the origin server. When a crawler requests a URL, the server evaluates the timestamp. If the content remains static, the server returns the 304 status code with an empty body. The crawler registers the page as verified. Zero HTML payload is transferred. Bandwidth is conserved.
Dead pages require equally aggressive management. Standard 404 responses leave URLs in the active crawl queue for extended periods.
Implement HTTP 410 Gone directives for permanently deleted inventory.
| HTTP Status | Crawler Interpretation | Queue Action | Server Load Impact |
|---|---|---|---|
| 404 | Not Found | Retries periodically | High |
| 410 | Gone | Drops from index immediately | Low |
| 304 | Not Modified | Updates timestamp only | Minimal |
The 410 Gone status forcefully instructs the indexing engine to purge the URL. Repeated fetching stops immediately.
Adjusting crawl demand against capacity limits
Crawl Demand represents the search engine appetite for your content. Crawl Capacity Limit represents your infrastructure ability to serve that demand without crashing. When demand exceeds capacity, the origin server fails.
Monitor the logs for escalating 500 or 503 errors during heavy bot activity. These indicate a broken capacity limit. The search engine perceives server instability and drastically throttles crawl rates to protect the host.
Control the influx preemptively using the HTTP 429 status code.
A 429 Too Many Requests response acts as a pressure valve. Append a Retry-After header indicating when the crawler should return. This configuration rejects the immediate connection but preserves the Crawl Demand intent. The queue is paused, not abandoned. Server overload instances drop sharply. Processing power prioritizes actual user requests during peak traffic intervals.
Tracking AI bots, LLM crawlers, and edge computing impacts
Standard search engine crawlers aim for continuous indexing. AI architectures consume raw text for dataset compilation or real-time synthesis. Tracking these systems requires isolating exact user-agent strings at the HTTP request level. Log monitoring setups must explicitly filter for LLM ingestion bots.
Primary AI architectures utilize distinct user-agents. GPTBot handles OpenAI model training data extraction. OAI-SearchBot fetches real-time web content for search features. ClaudeBot retrieves data for Anthropic systems. PerplexityBot powers the Perplexity AI answer engine.
Isolate these specific user-agents in your log parsing logic. Do not lump them into generic bot traffic buckets.
Differential analysis: LLM crawlers vs standard googlebot
Evaluating LLM traffic requires different operational baselines than standard SEO bot analysis. Googlebot follows predictable refresh cycles based on historical URL update frequency. AI architectures operate differently. They deploy massive burst crawls during model training phases and ignore standard refresh signals entirely.
| Analysis Parameter | Standard Googlebot | LLM Crawlers (GPTBot, ClaudeBot) |
|---|---|---|
| Crawl Velocity Pattern | Steady, predictive pacing | Extreme burst spikes during training runs |
| Payload Priority | Full HTML parsing and JavaScript execution | Raw text extraction, aggressive JSON fetching |
| Resource Dependency | Heavy CSS and rendering engine reliance | Minimal rendering overhead |
| URL Discovery | Sitemaps and internal link graphs | External dataset seeding and user-prompted fetching |
Standard crawlers trigger origin server load consistently over a 24-hour cycle. AI crawlers exhaust connection pools within minutes if unmanaged. The load variance is severe.
Edge SEO implementations via Cloudflare workers
Processing aggressive AI crawling at the origin server wastes processing cycles. Push traffic management to the network edge. Cloudflare Workers intercept inbound HTTP GET requests before they reach your infrastructure.
Deploy serverless logic to parse the user-agent header dynamically.
- Extract the user-agent header from the incoming request payload.
- Execute regex pattern matching against a predefined list of known LLM bots.
- Apply dynamic routing or immediate connection termination protocols.
If an LLM crawler matches the blocked list, the Worker drops the connection. The origin server never registers the hit. You control the exact response status code returned to the bot.
addEventListener("fetch", event => {
  event.respondWith(handleRequest(event.request))
})

async function handleRequest(request) {
  const userAgent = request.headers.get("User-Agent") || ""
  if (userAgent.includes("GPTBot") || userAgent.includes("ClaudeBot")) {
    return new Response("Access Denied", { status: 403 })
  }
  return fetch(request)
}
This edge implementation acts as a firewall for crawl capacity. It protects origin server load without relying on reactive IP table blocks. Filtering happens dynamically based strictly on the user-agent string presented during the handshake phase.
Data retention protocols for crawl rate variance modeling
Predicting origin server load requires robust historical data modeling. AI bot traffic exhibits massive volatility. A data ingestion run triggers heavy bandwidth consumption over a narrow window. This is usually followed by weeks of absolute silence.
Establish strict log retention protocols to calculate this crawl rate variance accurately.
- Retain raw access logs containing AI user-agents for a minimum 90-day rolling window.
- Export edge request logs directly to cold storage via API streams.
- Calculate the standard deviation of daily hit counts specific to ClaudeBot and GPTBot clusters.
Short retention windows mask the true impact of LLM architectures. A standard 30-day view might show zero GPTBot activity if it falls perfectly between model training phases. Expanding retention protocols allows data engineering teams to accurately model the statistical variance. This historical context informs precise rate-limiting rules at the edge, ensuring origin servers remain stable during sudden, high-volume ingestion sweeps.